Project Nexus

Feature reference

Everything Project Nexus does

271 capabilities across 61 topics and 6 areas. This page is generated from the application's own user guide at build time, so it lists what the product ships — not what a brochure remembered to mention.

Portfolio & Analytics

18 topics · 67 capabilities
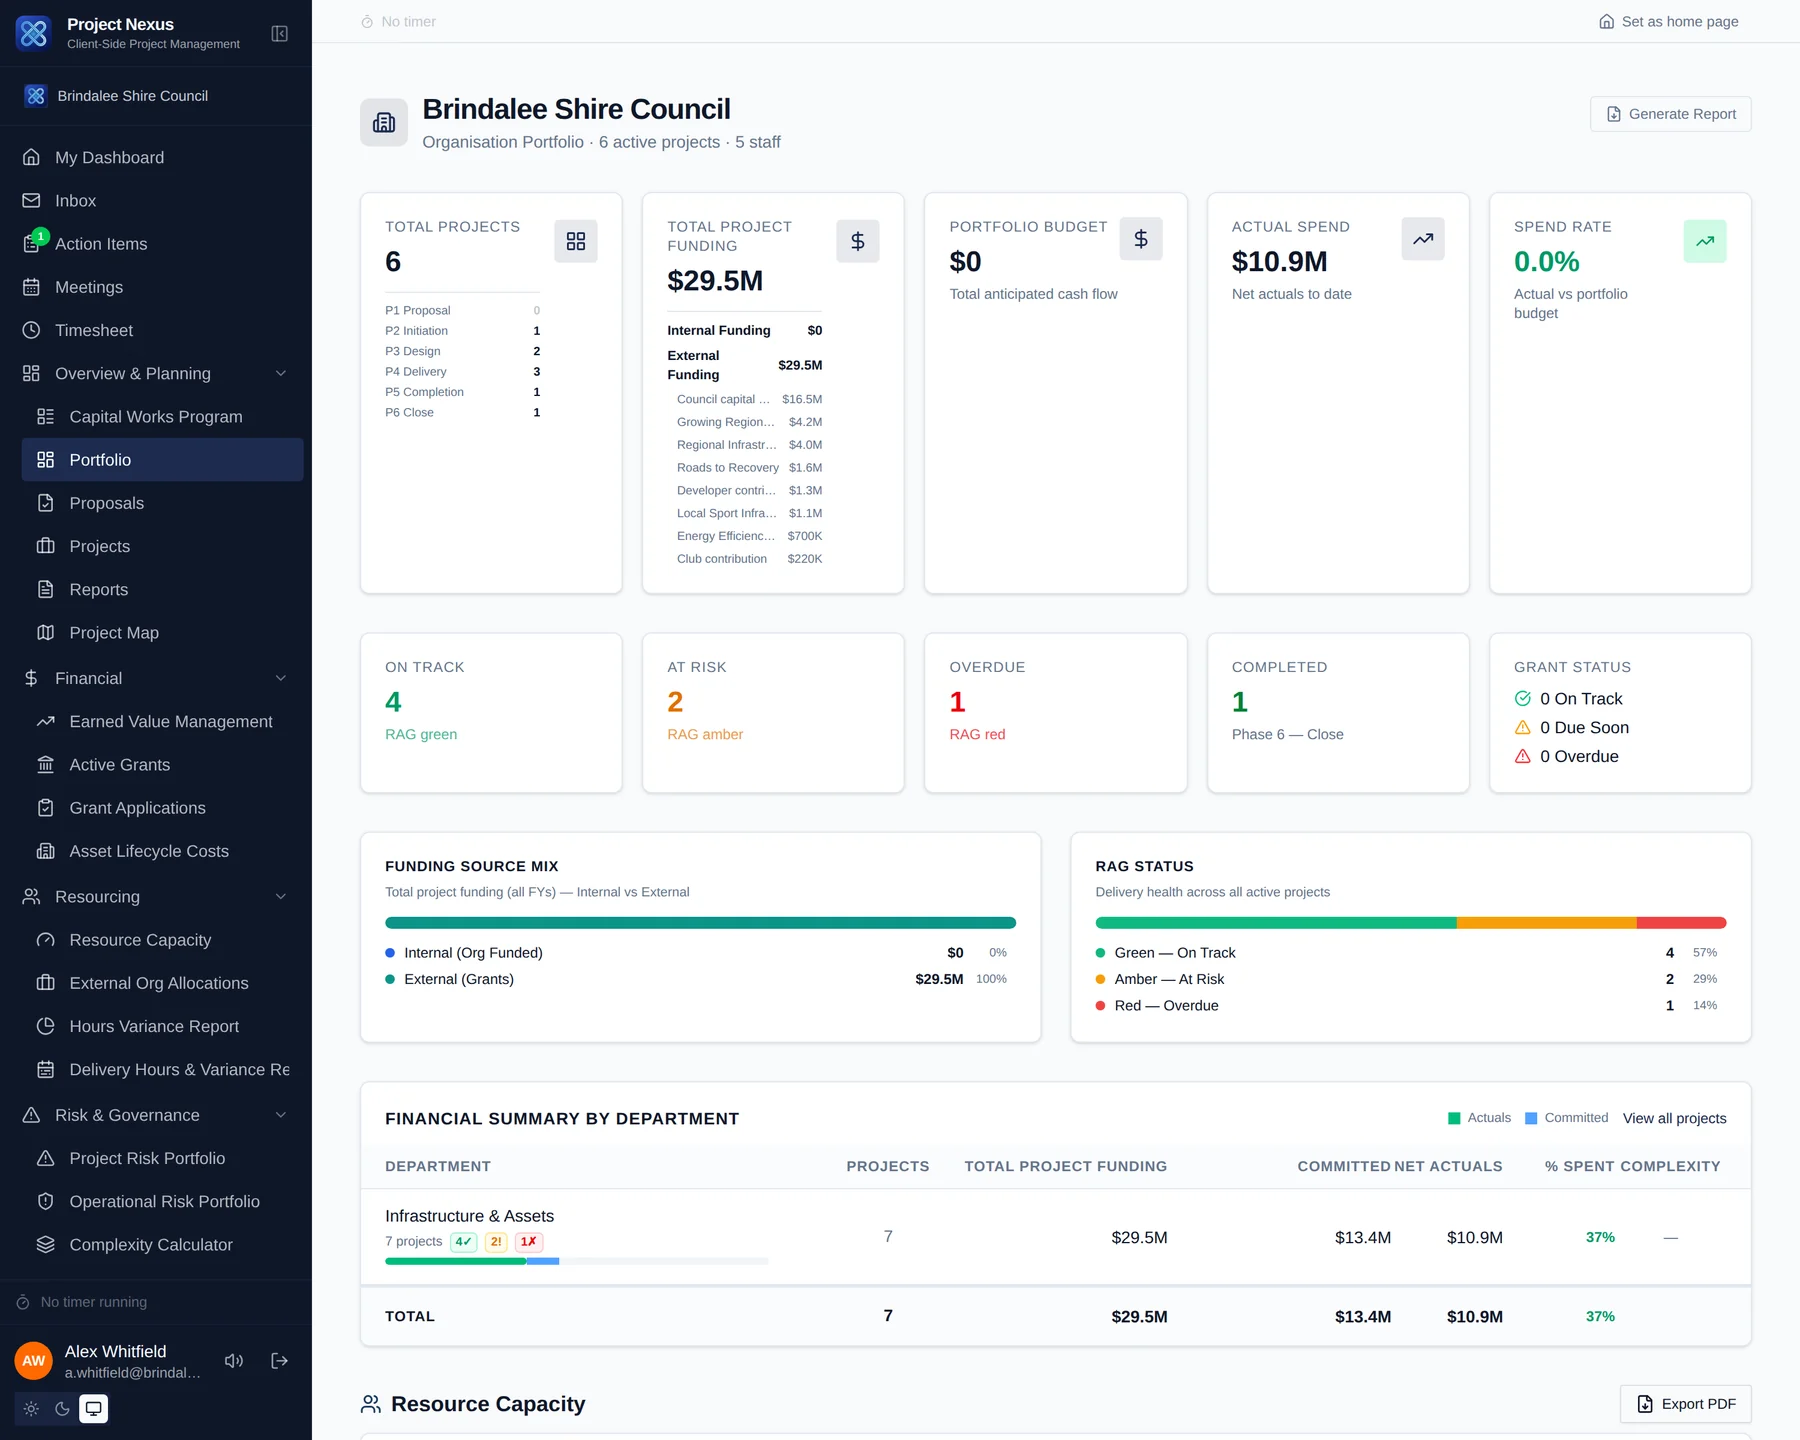
An organisation portfolio dashboard showing total project funding, actual spend, RAG status across the program and a financial summary by department
The organisation portfolio — funding mix, RAG and spend by department
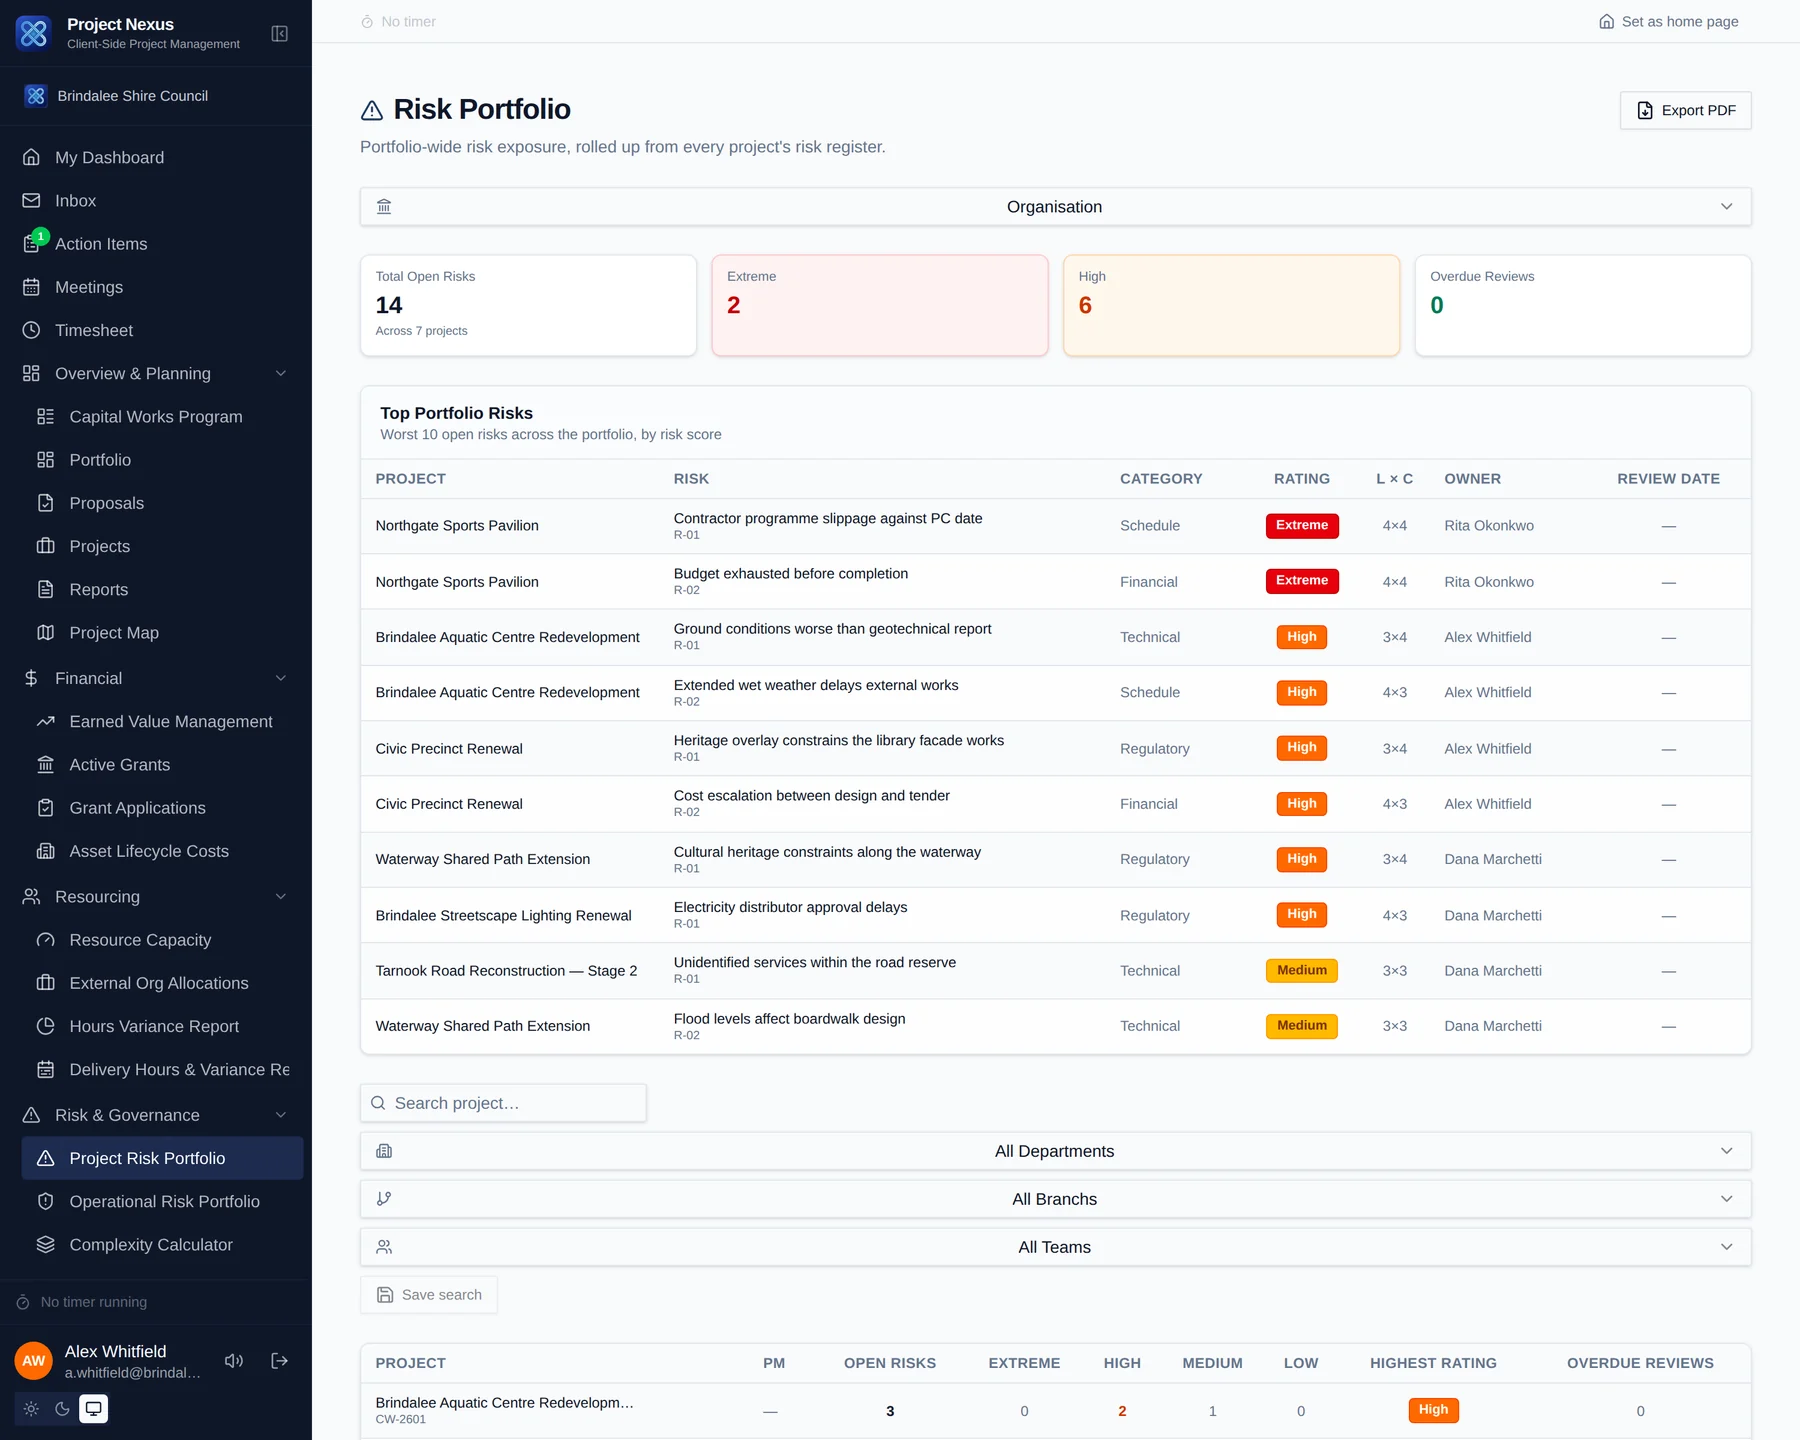
A portfolio risk page listing the worst open risks across the program with their category, rating, likelihood, consequence and owner
Portfolio-wide risk exposure, rolled up from every project register

My Dashboard Portfolio & Analytics

Overview tiles
Your personal dashboard shows a summary of active projects, upcoming milestones, recent action items, and RAG status tiles for projects you are assigned to.
Quick links
Use the dashboard to jump directly to your most recent projects, pending timesheets, and unread inbox messages.
Personalisation
Click 'Set as home page' on any page to change your default landing page after login.
My calendar
The My Calendar section shows all upcoming milestones and meetings across your assigned projects in a monthly view.

Reports & Reporting Portfolio & Analytics

Project progress report
Generate a PDF progress report from the Reports tab. Includes RAG status, milestones, financials, risks, photos, and key narrative sections.
Project summary
A one-page PDF with RAG band header, key financial metrics, milestone summary, and top risks table. Available from the project header.
Capital Works Program
The Program page provides a portfolio-level overview of all capital works — RAG statuses, stage distribution, financial summary, and a Health column summarising each project's combined RAG/budget/schedule status at a glance.
Completion FY & Carry Forward
Every program entry requires a Completion Financial Year. In the 5-Year Capital Forecast, any budget year later than a project's Completion FY is automatically classified as Carry Forward rather than counted as planned in-year spend.
Concise Project Report & Action to be Taken
Each row can show a Concise Project Report summary and, when a report flags an issue, an 'Action to be Taken' box highlighted for visibility — surfaced both on-screen and in the Capital Works Program PDF export.
Portfolio dashboard
The Portfolio page provides an org-wide view with tile summaries, expenditure charts, and milestone health across all projects.
Cost Benchmarking
Compare project metrics (cost per square metre, delivery time) across similar completed projects to inform future estimates.

Project Map Portfolio & Analytics

Map view
The Project Map shows all projects with location data plotted on an interactive map. Pins are coloured by RAG status (green, amber, red).
Setting location
Set a project's location coordinates on the project edit form. The location is then shown on the map.

Departments, Branches & Teams Portfolio & Analytics

Department portfolio
Click a department in the sidebar to view all projects assigned to that department with rollup financials and milestone status.
Branch portfolio
Click a branch to see all branch-level projects and staff.
Team portfolio
Click a team to see all projects the team is responsible for, along with CSAT scores and milestone health.

Recent Activity Portfolio & Analytics

Activity feed
The Recent Activity page shows a chronological feed of all changes across your portfolio — new reports, updated statuses, uploaded documents, and completed milestones.
Filtering
Filter the activity feed by project, user, activity type, or date range.

Active Grants Portfolio & Analytics

Overview New
Active Grants rolls up external grant funding across every project in the organisation — active grants, total funding, and acquittal milestone health — in one place.
External funding only New
Active Grants only includes grants recorded with category 'External' on a project's Grant & Income Agreements tab. Internal funding allocations are excluded, and a project with no external funding won't appear in the list.
Milestone health New
Each project shows counts of On Track, At Risk (acquittal due within 90 days), and Overdue grant milestones, plus the date of the next upcoming milestone.
Upcoming & overdue milestones New
A portfolio-wide table lists every unresolved grant milestone across all projects, sorted by due date, so acquittal deadlines are never missed.
Filtering New
Use the search box and Department / Branch / Team filters to narrow the view to a specific part of the organisation.
PDF export New
Click 'Export PDF' to generate a portfolio-wide Active Grants report for distribution or board reporting.

Grant Applications Portfolio & Analytics

Overview New
Grant Applications, under Grant Tracking, rolls up every project's grant application readiness assessment across the organisation — grants sought, estimated funding, and recommendation status — in one place.
Readiness score New
Each project shows a readiness score (out of 5) covering guideline familiarity, Council eligibility, adequate time to submit, alignment with the Council Plan, and SLT notification.
Recommendation status New
Filter and review each project's Proceed / Do Not Proceed / Pending recommendation for its prospective grant application.
Filtering New
Use the search box and Department / Branch / Team filters to narrow the view to a specific part of the organisation.
PDF export New
Click 'Export PDF' to generate a portfolio-wide Grant Applications report for distribution or board reporting.

Risk Portfolio Portfolio & Analytics

Overview New
The Risk Portfolio page rolls up open risks across every project — total counts, rating breakdowns, and the top-scoring risks portfolio-wide.
Top portfolio risks
The top of the page lists the highest-scoring open risks across the whole organisation, regardless of which project they belong to, so leadership can see the most severe exposures first.
Filtering by team, branch, department New
Use the Department, Branch, and Team dropdowns alongside the search box to narrow the per-project risk table to a specific part of the organisation.
Saved searches New
Once you've set up a useful combination of search text and Department/Branch/Team filters, click 'Save search' to name and store it. Saved searches appear as chips below the filters — click one to reapply it instantly, or the × to delete it.
PDF export
Click 'Export PDF' to generate a portfolio-wide risk report.

EVM Portfolio Portfolio & Analytics

Overview
The EVM Portfolio page shows Earned Value Management metrics — CPI, SPI, BAC, EAC and more — rolled up across every project, not just one.
Filtering & sorting
Filter by department, branch, team, or project manager, and sort by any EVM metric to quickly find projects that are over budget or behind schedule.
Schedule-adjusted metrics
The portfolio view includes schedule-variance-adjusted EAC and cost exposure figures, highlighting projects where a schedule delay is translating into real cost risk.
See also
For an explanation of what each EVM metric means, see 'EVM Metrics' under Financials & Grants.

Sustainability Portfolio Portfolio & Analytics

Overview
The Sustainability page rolls up embodied carbon, energy, and certification data recorded against projects across the whole portfolio.
Carbon intensity
Carbon intensity is calculated automatically wherever the underlying figures are recorded, letting you compare projects of different sizes fairly. See 'Sustainability' under Project Delivery for the exact formula, which varies by each project's auto-detected sustainability project type.
Certifications
Track sustainability certification targets and achievements (e.g. Green Star, NABERS) across all projects from one view.

Weather Delay Correlation Portfolio & Analytics

Overview
This page correlates recorded weather events (rainfall, extreme heat, etc.) against project schedule delays and EOT (Extension of Time) claims across the whole portfolio.
Cost exposure
Weather-attributable schedule delay is converted to an estimated cost exposure figure using each project's own daily burn rate. See 'Weather Log & EOT Register' under Project Delivery for the exact formula and thresholds.

Asset Lifecycle Costs Portfolio & Analytics

Overview
Asset Lifecycle Costs tracks the whole-of-life cost of delivered assets — replacement value, useful life, and annual operations & maintenance cost — across every project.
Forecast & budget planning
The forecast view projects future renewal/replacement costs by year, helping long-term asset management and budget bid planning.
Historical assets
Add assets from projects delivered before this platform was in use, so whole-of-portfolio lifecycle costing is complete.

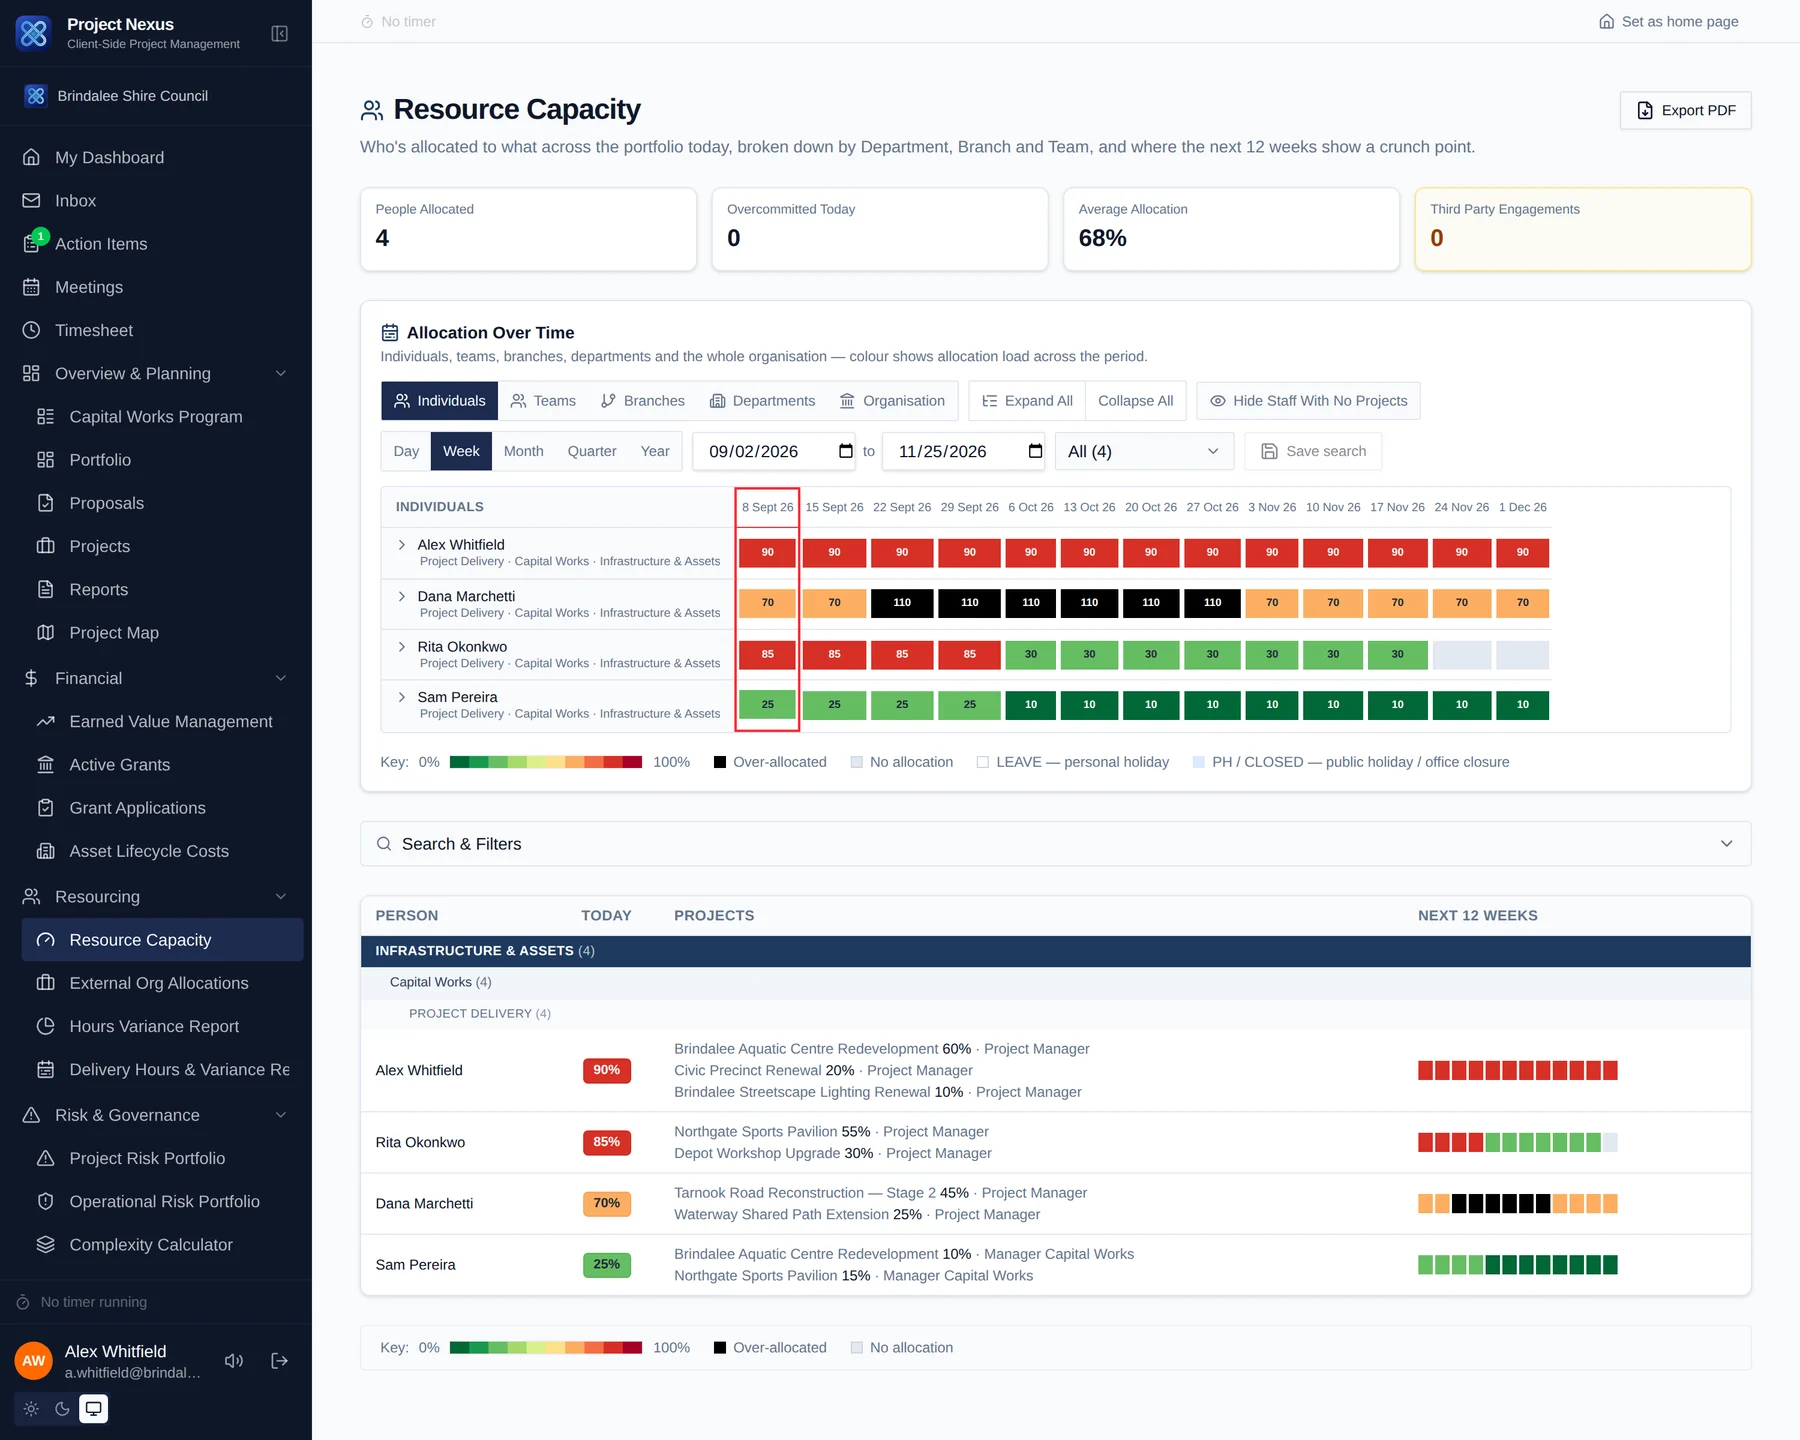
Resource Capacity Portfolio & Analytics

Overview
Resource Capacity shows how team members' time is allocated across active projects, helping identify over-committed staff and available capacity for new work.

External Org Allocations Portfolio & Analytics

Overview
External Org Allocations shows a portfolio-wide timeline heatmap of every External Organisation (Third Party contractor) and External Contact engagement across all projects, so over-committed contractors and available capacity are visible at a glance — the same heatmap engine used by Resource Capacity, scoped to external engagements only.
External Organisations vs External Contacts New
Toggle between External Organisations (Third Party contractor engagements, identified only by free-text contractor name) and External Contacts (named individuals with their own Contact Register entry). Each entity's allocation is shown as a coloured cell per time bucket, with darker shading indicating higher combined allocation.
Granularity & range
Switch between day, week, month, quarter, and year buckets, and step the visible date range forward/backward — identical controls to Resource Capacity.
Contractor Register
The table below the heatmap lists every contractor/external contact with their current engagements and the projects each is allocated to, with sort, filter, and saved-search support.
Contractor Allocation Report (PDF) New
Export a PDF report styled the same as the Resource Capacity report: KPI tiles, a coloured allocation-over-time chart, Team/Branch/Department/Organisation rollups, and a closing table listing every External Organisation and External Contact with their Peak % allocation and associated projects.

CoR Compliance Portfolio Portfolio & Analytics

Overview
Rolls up Chain of Responsibility compliance across every project, aggregated at Project, Team, Branch, Department, and Organisation levels.
What's counted
For each scope, the rollup shows how many projects have a CoR register set up at all, plus totals of action-required items and open incidents across those projects. There is no percentage compliance score at any level — it is a count-based rollup by design.
PDF export
Export a portfolio-wide CoR Compliance report for a chosen scope.

Operational Risk Portfolio Portfolio & Analytics

Overview
Rolls up Operational Risk Register entries across Team, Branch, Department, and Organisation scopes — total counts, rating breakdowns, and top-scoring open risks — in the same style as the (separate) Risk Portfolio page.
PDF export
Export a portfolio-wide operational risk report for a chosen scope and format.

Gender Impact Assessments Portfolio & Analytics

Overview
Gender Impact Assessments rolls up every project's GIA (see 'Gender Impact Assessment (GIA)' under Project Delivery) across Project, Team, Branch, Department, and Organisation scopes, showing Overall Impact Level coverage and approval-status counts portfolio-wide.
Filtering
Filter by Department, Branch, or Team to focus on a specific part of the organisation.
PDF export
Export a portfolio-wide Gender Impact Assessments report.

Project Manager Allocation Portfolio & Analytics

Overview New
Project Manager Allocation (formerly 'PM Utilisation') estimates how heavily each Project Manager's active project load utilises their available working hours, using a choice of three calculation methods.
Nexus method
workloadHours = Σ over active projects of (baseHoursPerProject + (project value ÷ $1,000,000) × hoursPerMillion) × complexityMultiplier. Defaults: baseHoursPerProject = 60, hoursPerMillion = 80 (both user-editable, persisted per-browser). complexityMultiplier = 100% + the project's own Complexity Calculator score, or a flat 100% (×1.0, 'assume low complexity') if the project hasn't been assessed yet — so a fully-assessed project's multiplier ranges 100%-200% (×1.0-×2.0), and is no longer a manual per-project Low/Medium/High selection. 'Value' is the project's Total Org Approved Budget.
Power Law Trendline (PLT) method New
effortPer100k = coefficient × value^exponent (defaults coefficient = 10536, exponent = −0.379, fitted to an industry decay curve where effort per dollar drops as project value grows); workloadHours = effortPer100k × (value ÷ $100,000). PLT uses each project's Total Funding (funding sources + grants, falling back to Approved Budget) rather than the Nexus method's Total Org Approved Budget.
Resource Capacity (actual) method
Instead of an estimate, this method averages the PM's own real recorded allocation-percent figures from Resource Capacity's timeline over the selected financial year/granularity — i.e. what was actually booked against them, not a formula-derived guess.
Band capacities
Utilisation % = round(workloadHours ÷ band capacity × 100). Default annual capacities: Bands 4–8 and Elevated Manager = 1,976 hours/year (38 hrs/week × 52 weeks, per the Indoor/Outdoor Staff Banding Award effective 28 Nov 2025); Manager = 1,800 hours/year; General Manager and CEO = 2,000 hours/year.
Portfolio $ benchmarks
A separate simple benchmark compares each band's total Portfolio $ (sum of each PM's projects' Total Funding) against a target: Band 7 = $6.5M, Band 6 = $2.75M, Band 5 = $1.25M.
Comparison chart & export
View a per-PM comparison chart across financial years, and export a PDF report — choosing which calculation method(s) to include via the Export PDF dialog.

Project Delivery

25 topics · 129 capabilities
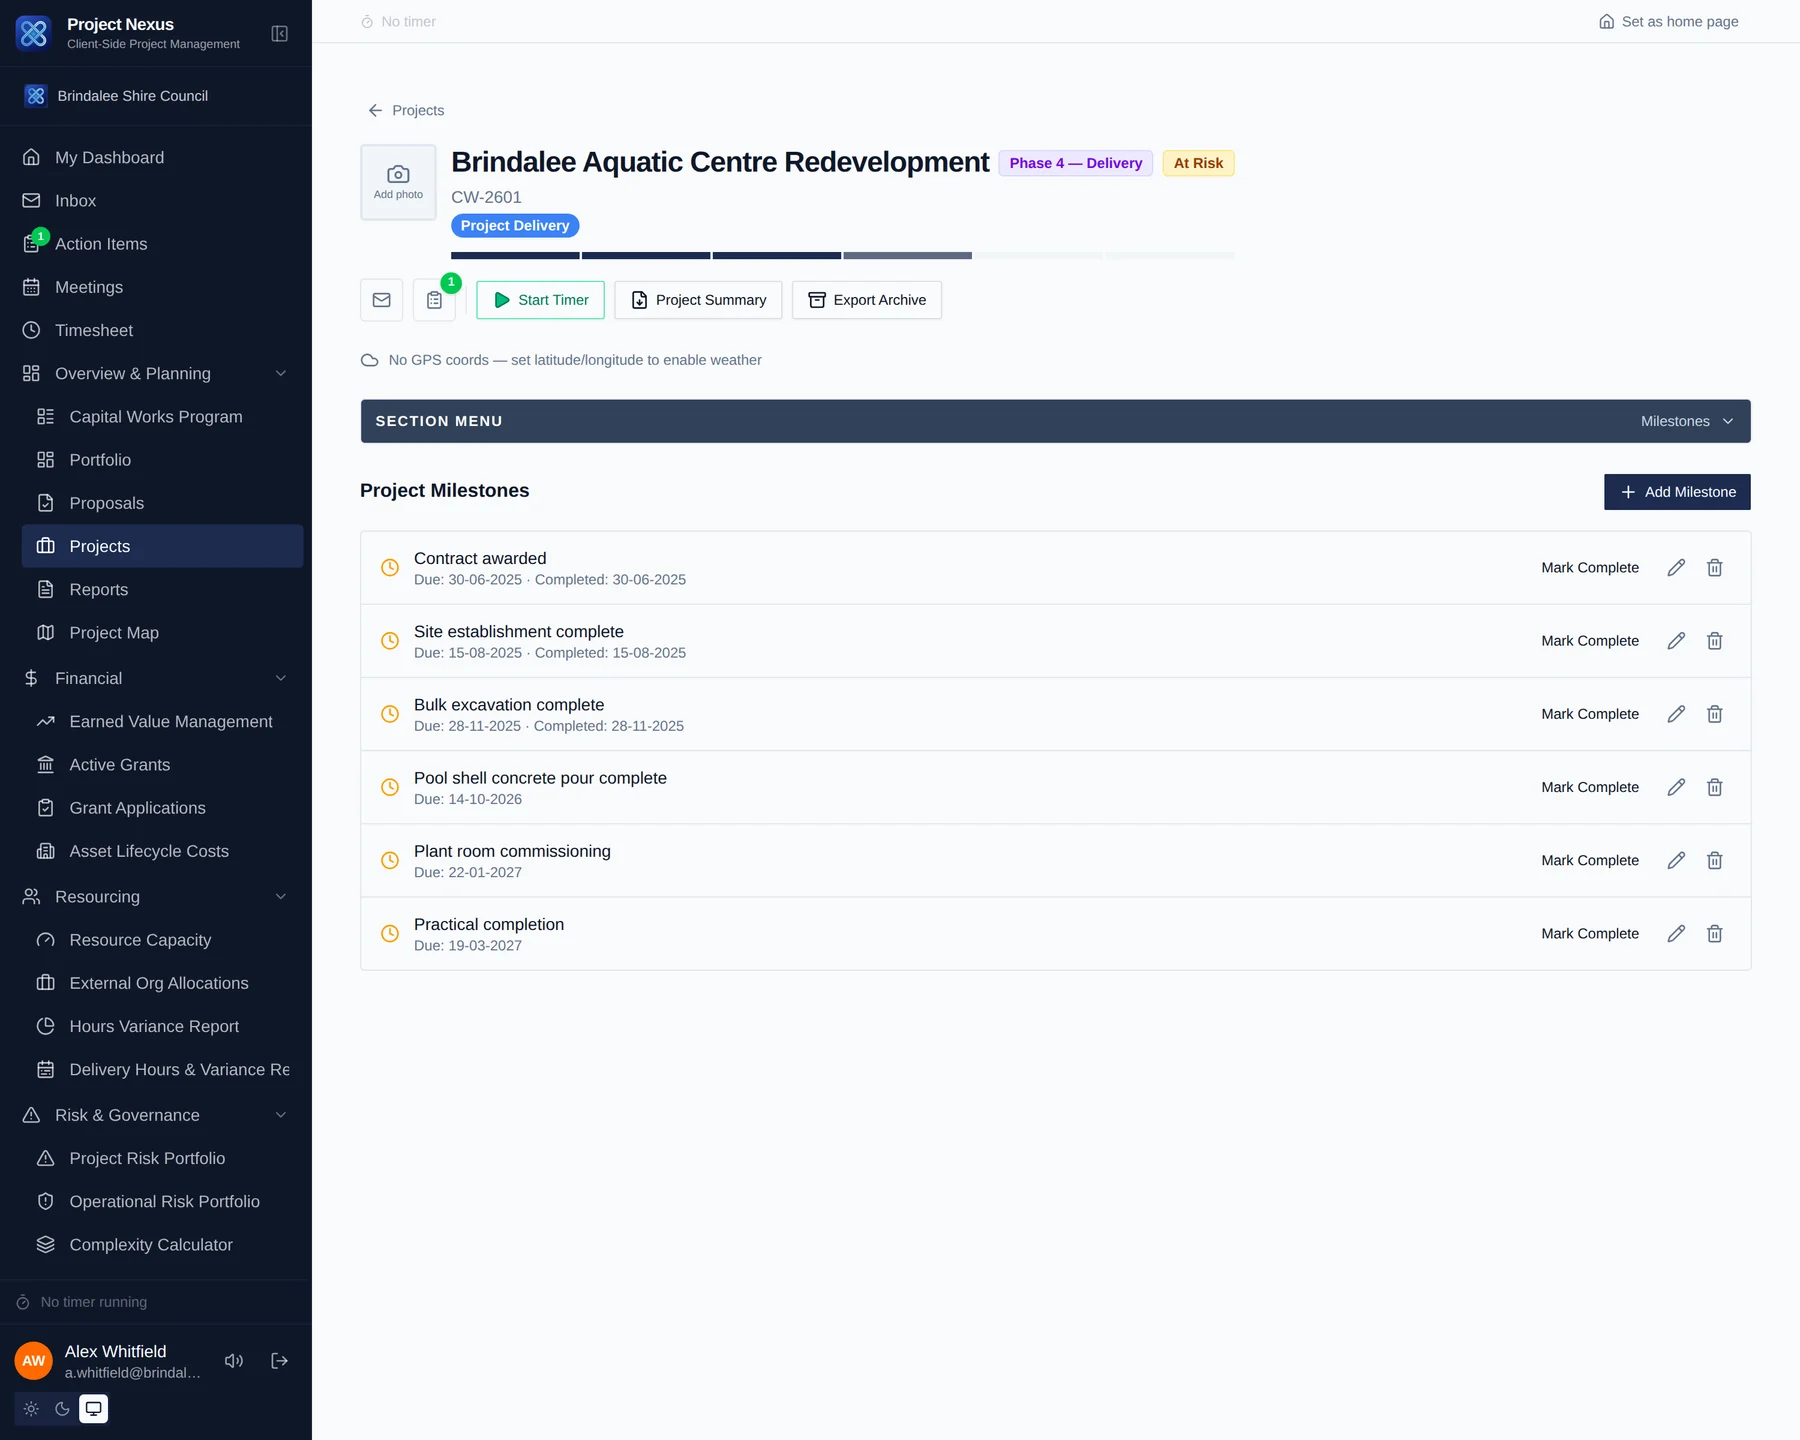
A project milestone list showing planned dates and completion status
Milestones against the programme, flagged when they slip

Projects Project Delivery

Project list
Browse all projects in your organisation. Use the search bar and filters to narrow by stage, status, department, branch, or team. Multi-site (parent/child) projects are shown with a hierarchy indent.
Creating a project
Click 'New Project' and fill in the project name, description, department, branch, budget, and stage. Projects start at Stage 1 by default.
Project detail tabs
Each project has a set of tabs: Calendar, Overview, Milestones, Project Programme, Financials, Reports, Documents, Transmittals, Incoming Mail, Messages, Defects/DLP, Project Team, SI/RFI, GIA, Phase Gate, Risk Register, Complexity, Quality, Insurance, Governance, Handover, Approvals Checklist, Project Checklist, Brief/Business Case, Photos, and Chat.
RAG status
Set the project's Red/Amber/Green status on the Overview tab to communicate overall health at a glance.
Stage advancement
Use the Phase Gate tab to check completion criteria before advancing a project. Advancement requires the appropriate approval role (Manager, General Manager, CEO, or Admin).
Parent / child projects
Link related sub-projects under a parent project to group multi-site capital works. The parent shows a rollup of child financials and statuses.
Project summary PDF
Click 'Project Summary' in the project header to generate a one-page PDF showing RAG status, key financials, milestone summary, and top risks. Useful for briefing senior management.
Project map
View all projects on an interactive map. Projects with location data show as pins coloured by RAG status.
Bulk create & update
Use 'Bulk Import' on the Projects list to create many projects at once from a spreadsheet, or 'Download Template' from the same menu to bulk-update existing projects' core fields. See 'Bulk Import Templates' under Administration for details.

Milestones Project Delivery

Adding milestones
Open the Milestones tab on a project. Click 'Add Milestone' and set the name, planned date, responsible person, and phase.
Milestone status
Mark milestones as Not Started, In Progress, Complete, or At Risk. Overdue milestones are automatically flagged in red.
Milestone templates
Import a set of standard milestones from the organisation's Milestone Template library to quickly populate a new project's schedule.
Phase gate linkage
Milestones can be linked to phase gate criteria so that completing a milestone automatically ticks off a gate requirement.

Project Programme (Gantt) Project Delivery

Full Gantt chart
The Project Programme tab shows an interactive bar chart with task bars spanning their start and end dates. Drag bars left or right to reschedule. Drag the right edge to extend duration. Double-click a bar to open the edit dialog.
Task dependencies
Dependencies between tasks are shown as arrows on the chart. Add predecessor task IDs when creating or editing a task to link them with a finish-to-start relationship.
View modes
Switch between Day, Week, Month, and Year views using the dropdown in the top-right corner of the schedule tab.
Adding tasks
Click 'Add Task' to create a schedule task. Set the name, WBS code, type (Task / Milestone / Summary), start and end dates, % complete, resources, and notes.
Task list view
Switch to the Task List tab to see all tasks in a table with WBS codes, durations, progress bars, resource assignments, and status badges. Edit or delete tasks from this view.
MS Project import
Click 'Import MS Project' and select an XML file exported from Microsoft Project (File → Save As → XML Format .xml). All tasks, WBS codes, durations, predecessors, and resource names are imported.
MS Project export
Click 'Export MS Project' to download the current schedule as a Microsoft Project-compatible XML file. Open it directly in MS Project for further editing.
Progress tracking
Update % Complete on each task as work progresses. The Gantt chart shows progress as a filled portion of the bar.

Risk Register Project Delivery

Adding risks
Open the Risk Register tab on a project. Click 'Add Risk', describe the risk, and set the likelihood (1–5) and consequence (1–5). The score and rating are calculated automatically.
Risk matrix
Score > 16: Extreme. Score > 9: High. Score > 4: Medium. Else: Low. The colour-coded tile on the project overview shows the highest-rated open risk.
Mitigation actions
Record mitigation strategies and assign owners. Update residual risk scores after controls are in place.
Risk library
Administrators manage a library of common risks. Project managers can import library risks directly into their project risk register.
Portfolio-wide view
This tab covers risks for a single project. To see the highest-scoring open risks and rating breakdowns across every project at once, see 'Risk Portfolio' under Portfolio & Analytics.

Complexity Calculator Project Delivery

What is it?
The Complexity Calculator (on the Risk tab) provides a structured assessment of project complexity across seven dimensions, informed by the PCRAM (Project Complexity and Risk Assessment Model) framework.
Seven dimensions & weights
Scored dimensions and their weight in the overall score: Scope & Technical Complexity (20%), Delivery & Schedule Complexity (20%), Stakeholder & Community Complexity (15%), Commercial & Procurement Complexity (15%), Regulatory & Environmental Complexity (10%), Organisational Capability (10%), and External Dependencies (10%). Each dimension's criteria are scored 1–5 and averaged.
How the score is calculated
Each dimension's average score (1–5) is converted to a percentage — ((average − 1) ÷ 4) × 100 — then combined using its weight above. If a dimension is left unscored, the overall percentage is re-normalised across only the dimensions that were actually scored, so an incomplete assessment isn't unfairly dragged down.
Overall rating thresholds
The weighted percentage maps to an overall complexity rating: Low (0–25%), Moderate (25–50%), High (50–75%), or Very High (75–100%).
PDF export
Export the completed complexity assessment as a PDF report for inclusion in project documentation.
Risk register implications
High complexity ratings automatically flag suggested risk considerations for the project risk register.

Quality Management (ITP & NCR) Project Delivery

Inspection and Test Plans (ITPs)
Create ITPs on the Quality tab to define inspection points, hold points, and witness points for construction activities. Link each ITP to a specification reference.
Non-Conformance Reports (NCRs)
Log NCRs when construction does not meet the specified standard. Each NCR captures the non-conformance description, root cause, corrective action, and closure date.
NCR severity
NCRs are categorised as Major, Minor, or Observation. Open NCRs are tracked until formally closed.
Quality summary tile
The project overview shows a Quality tile summarising open NCRs and pending ITP sign-offs so issues are visible at a glance.
PDF export
Export the full ITP or NCR register as a PDF for inclusion in project quality records.

Insurance Register Project Delivery

Recording policies
On the Insurance tab, record all insurance policies required for the project — public liability, contract works, professional indemnity, workers compensation, and more.
Expiry alerts
Policies approaching expiry are automatically flagged on the project and on the Org Dashboard alerts panel. Alerts trigger at 30, 60, and 90 days before expiry.
Policy details
Each record stores the policy number, insurer, coverage type, coverage amount, start and expiry dates, and broker contact details.
Contractor insurance
Insurance records can be linked to specific contractors so that contractor compliance is tracked alongside project records.

Governance Project Delivery

Council decisions
The Governance tab records council resolutions and formal decisions relevant to the project — including resolution numbers, decision dates, and meeting references.
Tender register
Record all tenders issued and received for the project, tracking reference numbers, issue dates, close dates, number of respondents, and awarded contractors.
Community complaints
Log any community or stakeholder complaints received during the project. Track complaint status (open/resolved), response dates, and resolution actions.
Procurement & tender evaluations
The Procurement Register and Tender Evaluations sub-tabs record procurement activities and formal tender scoring, complementing the Tender register above.

Handover Project Delivery

Handover manuals
The Handover tab stores operation and maintenance manuals for assets delivered by the project. Upload files and record the asset type, supplier, and version.
As-built drawings
Record and upload as-built drawings. Tag each drawing with drawing number, revision, and discipline (civil, electrical, structural, etc.).
Warranties
Record all warranties for materials and equipment installed. Track warranty period, expiry date, and supplier contact for each item.
PC defects
Log Practical Completion defects identified during the PC inspection. Track each defect's status through to rectification and sign-off.

SI / RFI Management Project Delivery

Site Instructions
Record Site Instructions (SIs) issued to contractors on the Site Instructions tab, under Contracts. Each SI has a number, description, issue date, and cost impact.
Requests for Information
Log Requests for Information (RFIs) from contractors and track responses. Link RFIs to relevant drawings or specifications.
Email transmission
Send SIs and RFIs directly by email from within the system. Transmission history is logged against each record.

Gender Impact Assessment (GIA) Project Delivery

What is it?
The GIA tab (under Analytics & Insights) records a structured Gender Impact Assessment for the project — a distinct assessment from grant funding, despite sharing the 'GIA' abbreviation. It documents who is affected by the project, how, and what's being done about any differential impact.
Overall Impact Level
Set an Overall Impact Level of Low (minimal direct gendered impact), Medium (some differential gendered impact), or High (significant gendered impact requiring action) — a qualitative judgement made by the assessor, not a calculated score.
Assessment fields
Record the project description, primary beneficiaries, gender considerations identified, and mitigation actions. Where relevant, flag that community consultation or ongoing monitoring is required and record the details of each.
Rationale
A dedicated Rationale field captures the reasoning behind the chosen Overall Impact Level, alongside the level itself, so the assessment's judgement call is documented and auditable.
Approval workflow
GIAs move through Draft, Submitted, and Approved status, with prepared-by, reviewed-by, and approved-by/approved-date fields recorded against the assessment.
PDF export
Export the completed assessment as a formatted PDF, including the Overall Impact Level, rationale, and all supporting fields, for inclusion in project governance records.
Portfolio-wide view
This tab covers GIA for a single project. To see impact-level coverage and outcomes collated across Project, Team, Branch, Department, and Organisation scopes, see 'Gender Impact Assessments' under Portfolio & Analytics.

Defects & DLP Project Delivery

Defect register
Log defects during the defects liability period (DLP). Each defect has a description, severity (Critical / High / Medium / Low / Informational), location, and status.
Defect photos
Attach photos directly to a defect record for documentation and contractor communication.
DLP tracking
Track the DLP end date and number of outstanding defects. Defects assigned in meetings automatically appear in Action Items.
Retention link
Outstanding PC and DLP defects are visible alongside retention amounts so you can judge when to release retention to the contractor.
Bulk import New
Import defects in bulk from an Excel (.xlsx) file, or best-effort import an SRP project export (.saProject) — useful when migrating a defects list from another inspection tool.

Documents & Files Project Delivery

Document library
The Documents tab stores all project files organised by category (Reports, Contracts, Drawings, Correspondence, etc.).
Uploading documents
Click 'Upload' and select a file. Files are stored securely in cloud object storage and can be downloaded at any time.
PDF markup and annotation
Click 'Mark up' on any PDF document to open the annotation tool. Add highlights, shapes, and comments. Publish your markup to share it with the team.
Version control
Upload new versions of an existing document. Previous versions are retained and accessible from the version history.
Generated documents
PDF and spreadsheet reports are downloaded only — they are not saved to the document library. Save your own copy of any exported report.

Document Transmittals Project Delivery

Creating a transmittal
On the Transmittals tab, create a formal document transmittal to package one or more project documents for issue to a recipient. Each transmittal gets a unique number.
Transmittal PDF
Generate a formatted transmittal cover sheet PDF listing all documents included, revision numbers, and transmission notes.
Transmission log
All transmittals are logged with the date sent, recipient, and status — providing a formal record of document issue for contract administration.

Incoming Mail Project Delivery

IMAP inbox
If your organisation has configured an IMAP mailbox, incoming emails are automatically polled and displayed on the Incoming Mail tab of each project.
Reading mail
Click any email to read the full message. Unread emails are highlighted; the tab badge shows the unread count.
Save to documents
Save an incoming email directly to the project's document library for formal record-keeping.

Project Photos Project Delivery

Photo gallery
The Photos tab shows a full gallery of all photos taken for the project. Photos can be tagged with a date and linked to a site inspection, RFI, or defect.
Uploading photos
Click 'Upload Photos' and select one or more images. Add a caption and select the date the photo was taken.
Favourites, rotation & exclude from reports New
Star a photo as a favourite to have it appear enlarged in the PDF report layout. Rotate a photo 90° at a time without altering the original file. Mark a photo 'Exclude from Reports' to keep it out of every PDF export, even if it's explicitly selected for one.
Persistent filter bar & saved searches New
Filter the gallery by search text, date range, tags, or favourites-only, and save a filter combination as a named saved search for one-click reuse later.
Selection mode New
Toggle selection mode to tick specific photos, then export just that selection as a PDF instead of exporting by filter.
Photo Report PDF New
Export a site-photo PDF with favourites shown enlarged in their natural position among the other photos, continuous photo numbering, date/tag/GPS captions, optional grouping by year/quarter/month/week/day with a section heading per group, and a location map page per group plotting every photo's numbered pin.
Markup tool New
Open a photo's markup editor to draw lines, arrows, text, and shapes directly on it. Publish the markup to flatten it onto the photo wherever it's exported.
Mini gallery
Site inspections, RFIs, and defects each show a photo strip for easy visual reference without leaving the record.

Brief & Business Case Project Delivery

Project brief
The Brief section captures the project background, objectives, scope, constraints, and stakeholders. It is typically completed at the start of a project.
Business case
The Business Case section documents the options analysis, preferred option, cost-benefit summary, and recommendation for approval.
Cost Benefit Analysis
The Cost Benefit Analysis sub-tab lets you itemise the options considered, their costs and benefits, and record which option was selected and why — feeding the Business Case summary.
Export to PDF or Word
Export the Brief and Business Case as a formatted PDF or Word document for submission to council or senior management.

Checklists Project Delivery

Project checklist
The Project Checklist tab shows tasks to complete at various project stages. Items can be ticked off, added manually, or imported from the organisation's checklist library.
Checklist library
Administrators manage the organisation's checklist library in the Org Dashboard. Items are grouped by category and can be imported into any project.
Approvals checklist
The Approvals Checklist tracks formal approval items (council resolutions, regulatory sign-offs) required at each phase gate.
Completion notes New
When ticking off a checklist item, optionally add a completion note explaining how or why it was completed. Notes are shown alongside the item and included in both the PDF and Excel exports, along with the completion timestamp.

Resourcing (Staff Gantt Chart) Project Delivery

Overview
The Resourcing tab shows a project-specific Staff Gantt Chart — who is allocated to the project, when, and at what percentage — separate from the task-based Project Programme (a read-only copy of the Project Programme is embedded alongside it for schedule context).
Adding an allocation
Click 'Add Allocation' and choose who the allocation is for: a User (a logged-in staff member), an Internal Contact (a non-login staff member recorded in the org's Contact Register), an External Contact (a named external person recorded in the Contact Register with contact type 'external'), or a Third Party / External Organisation (free-text contractor name, no Contact Register entry). Set the date range, allocation percentage, and project stage.
External Contact vs Third Party New
Use External Contact when the engagement is with a specific named individual you want to track by name across projects — they get their own row in every rollup and heatmap. Use Third Party / External Organisation for a contractor engagement tracked only by company/contractor name, with no individual identity recorded.
Predecessors & baseline
Link an allocation to a predecessor allocation for finish-to-start dependency arrows on the chart. Click 'Set Baseline' to snapshot the current schedule for later comparison against actual progress.
Zoom & view range
Zoom to the whole project or a custom date range, and use the Gantt/List toggle to switch between the visual chart and a sortable table view.
MS Project import/export
Import an MS Project XML file to bulk-create allocations, or export the current Staff Gantt Chart to MS Project XML for offline editing.
PDF export
Export the Staff Gantt Chart as a formatted PDF, with third-party/contractor bars shaded distinctly from staff allocations.

Community Engagement Plan Project Delivery

Prepare → Plan → Act → Feedback
The Community Engagement Plan tab structures community/stakeholder engagement into four steps: Prepare (stakeholder mapping and readiness), Plan (the engagement plan itself), Act (delivery logistics and resourcing), and Feedback (closing the loop and evaluating outcomes).
Stakeholder mapping
In the Prepare step, map each stakeholder by their level of impact, level of influence, and level of engagement, plus a category (e.g. resident, business, community group), to decide who needs what kind of engagement.
Engagement plan & communication methods
In the Plan step, define target groups, the level of engagement each will receive, the objectives for engaging them, and the communication methods used to reach them (e.g. letterbox drop, pop-up session, online survey).
Logistics, resources & risks
The Act step records the logistics for each engagement activity, the resources required, and any risks specific to delivering the engagement (e.g. weather-dependent events, access issues).
Closing the loop & results
The Feedback step records how the community was told what happened with their input ('closing the loop'), the measured results against objectives, and inclusive-engagement considerations for hard-to-reach groups.
Evaluation activities
Evaluation activities are categorised as process, participation, or outcomes evaluation, plus separate questions on the engagement's appropriateness, implementation quality, and reach.
Readiness checklist
Each step includes its own readiness checklist (e.g. 'Has a file been set up as a record of all documents?', 'Is there internal agreement on the purpose of the engagement?') so a plan can't move to the next step until its groundwork is confirmed.
Related registers
The Stakeholders tab lists individual stakeholder contacts for the project, the Consultation Register logs specific consultation activities and their outcomes, and Stakeholder Communications logs formal communications sent — all cross-referenced from the Community Engagement Plan.
PDF export
Export the full Community Engagement Plan as a formatted PDF for inclusion in project governance or council reporting.

Chain of Responsibility (CoR) Compliance Project Delivery

What is it?
The CoR Compliance tab tracks a project's obligations under Chain of Responsibility heavy-vehicle transport law — every party in the transport chain (not just the driver) can be held responsible for breaches.
Compliance header
Record the project's heavy vehicle activity level, whether NHVR (National Heavy Vehicle Regulator) permits apply, whether a transport safety plan is in place, and whether the head contract includes a CoR clause.
Obligations register
24 standard obligation items across 5 categories (A–E) are pre-populated for every project. Set each item's status to Compliant, Action Required, Pending, or Not Applicable, and record supporting notes/evidence.
Incident log
Log any CoR-related incidents (e.g. a mass, dimension, loading, fatigue, or speed breach) with date, description, and resolution.
No weighted score
Unlike the Risk Register or Complexity Calculator, CoR Compliance does not compute a weighted percentage score — compliance is reported as plain counts of items by status, plus counts of action-required items and open incidents.
Portfolio-wide view
This tab covers CoR compliance for a single project. To see obligation and incident counts rolled up across Project, Team, Branch, Department, and Organisation scopes, see 'CoR Compliance Portfolio' under Portfolio & Analytics.

Operational Risk Register Project Delivery

How it differs from the Risk Register
The Operational Risk Register is a separate register from the project's Risk Register — it's intended for organisational/operational risks (e.g. staffing, systems, compliance) rather than project-delivery risks, and is also embedded on the Team, Branch, Department, and Organisation dashboard pages, not just the project.
Same scoring, separate registers
Operational risks use the identical scoring formula as the project Risk Register — Score = Likelihood (1–5) × Consequence (1–5), rated Extreme (score > 16), High (> 9), Medium (> 4), or Low (≤ 4) — but the two registers are tracked and stored completely separately, so a risk must be entered into whichever register actually applies to it.
Bulk import
Download a spreadsheet template and bulk-upload multiple operational risks at once, rather than entering them one by one.
PDF export formats
Export the operational risk register as a PDF in a choice of formats, optionally including child-scope risks (e.g. a Branch export can include every Team beneath it).

SWMS Register Project Delivery

What is it?
The SWMS Register tab tracks Safe Work Method Statements — the documented safety plan required before high-risk construction work begins — for the project.
Standard obligations
A set of standard SWMS obligations is pre-populated for every project, so common requirements aren't missed.
Incident log
Log any safety incidents that occur during work covered by a SWMS, with date, description, and resolution, alongside the SWMS register itself.

Sustainability Project Delivery

What is it?
The Sustainability tab records embodied carbon, energy, and certification data for the project, feeding the portfolio-wide Sustainability Portfolio rollup.
Auto-tiering
Projects are automatically tiered and assigned a sustainability project type (e.g. Civil Infrastructure, Building/Facility) based on project attributes when created or edited, driving which carbon-intensity formula applies.
Carbon intensity formula
By default, carbon intensity = embodied carbon (tCO2e) ÷ floor area (m²), giving tCO2e per m². Where floor area isn't applicable, bulk-imported Civil Infrastructure projects instead use tCO2e per $M of approved budget, and Building/Facility projects use tCO2e per m² of gross floor area.
Certifications
Track sustainability certification targets and achievements (e.g. Green Star, NABERS) against the project.
Portfolio-wide view
This tab covers sustainability for a single project. To compare carbon intensity and certification coverage across every project, see 'Sustainability Portfolio' under Portfolio & Analytics.

Weather Log & EOT Register Project Delivery

Weather Log
Record daily weather observations (rainfall, max temperature, and other conditions) against the project, used to correlate weather events with schedule delay claims.
EOT Register
The Extension of Time (EOT) Register logs EOT and Notice of Delay (NOD) claims, each with an approval status and number of approved days. Claims flagged weather-related, or with a heat/rain NOD reason, feed the weather-delay cost exposure calculation.
Heat day & correlation window
A day counts as an extreme-heat day at 35°C or above. Claims are correlated against logged weather events within a 3-day window either side of the claimed date.
Cost exposure formula
Weather cost exposure = total approved weather-related EOT/NOD days × daily burn rate, where daily burn rate is Actual Cost (AC) ÷ elapsed project days from the project's EVM figures. See 'Weather Delay Correlation' under Portfolio & Analytics for the portfolio-wide view.

Financials & Grants

4 topics · 27 capabilities
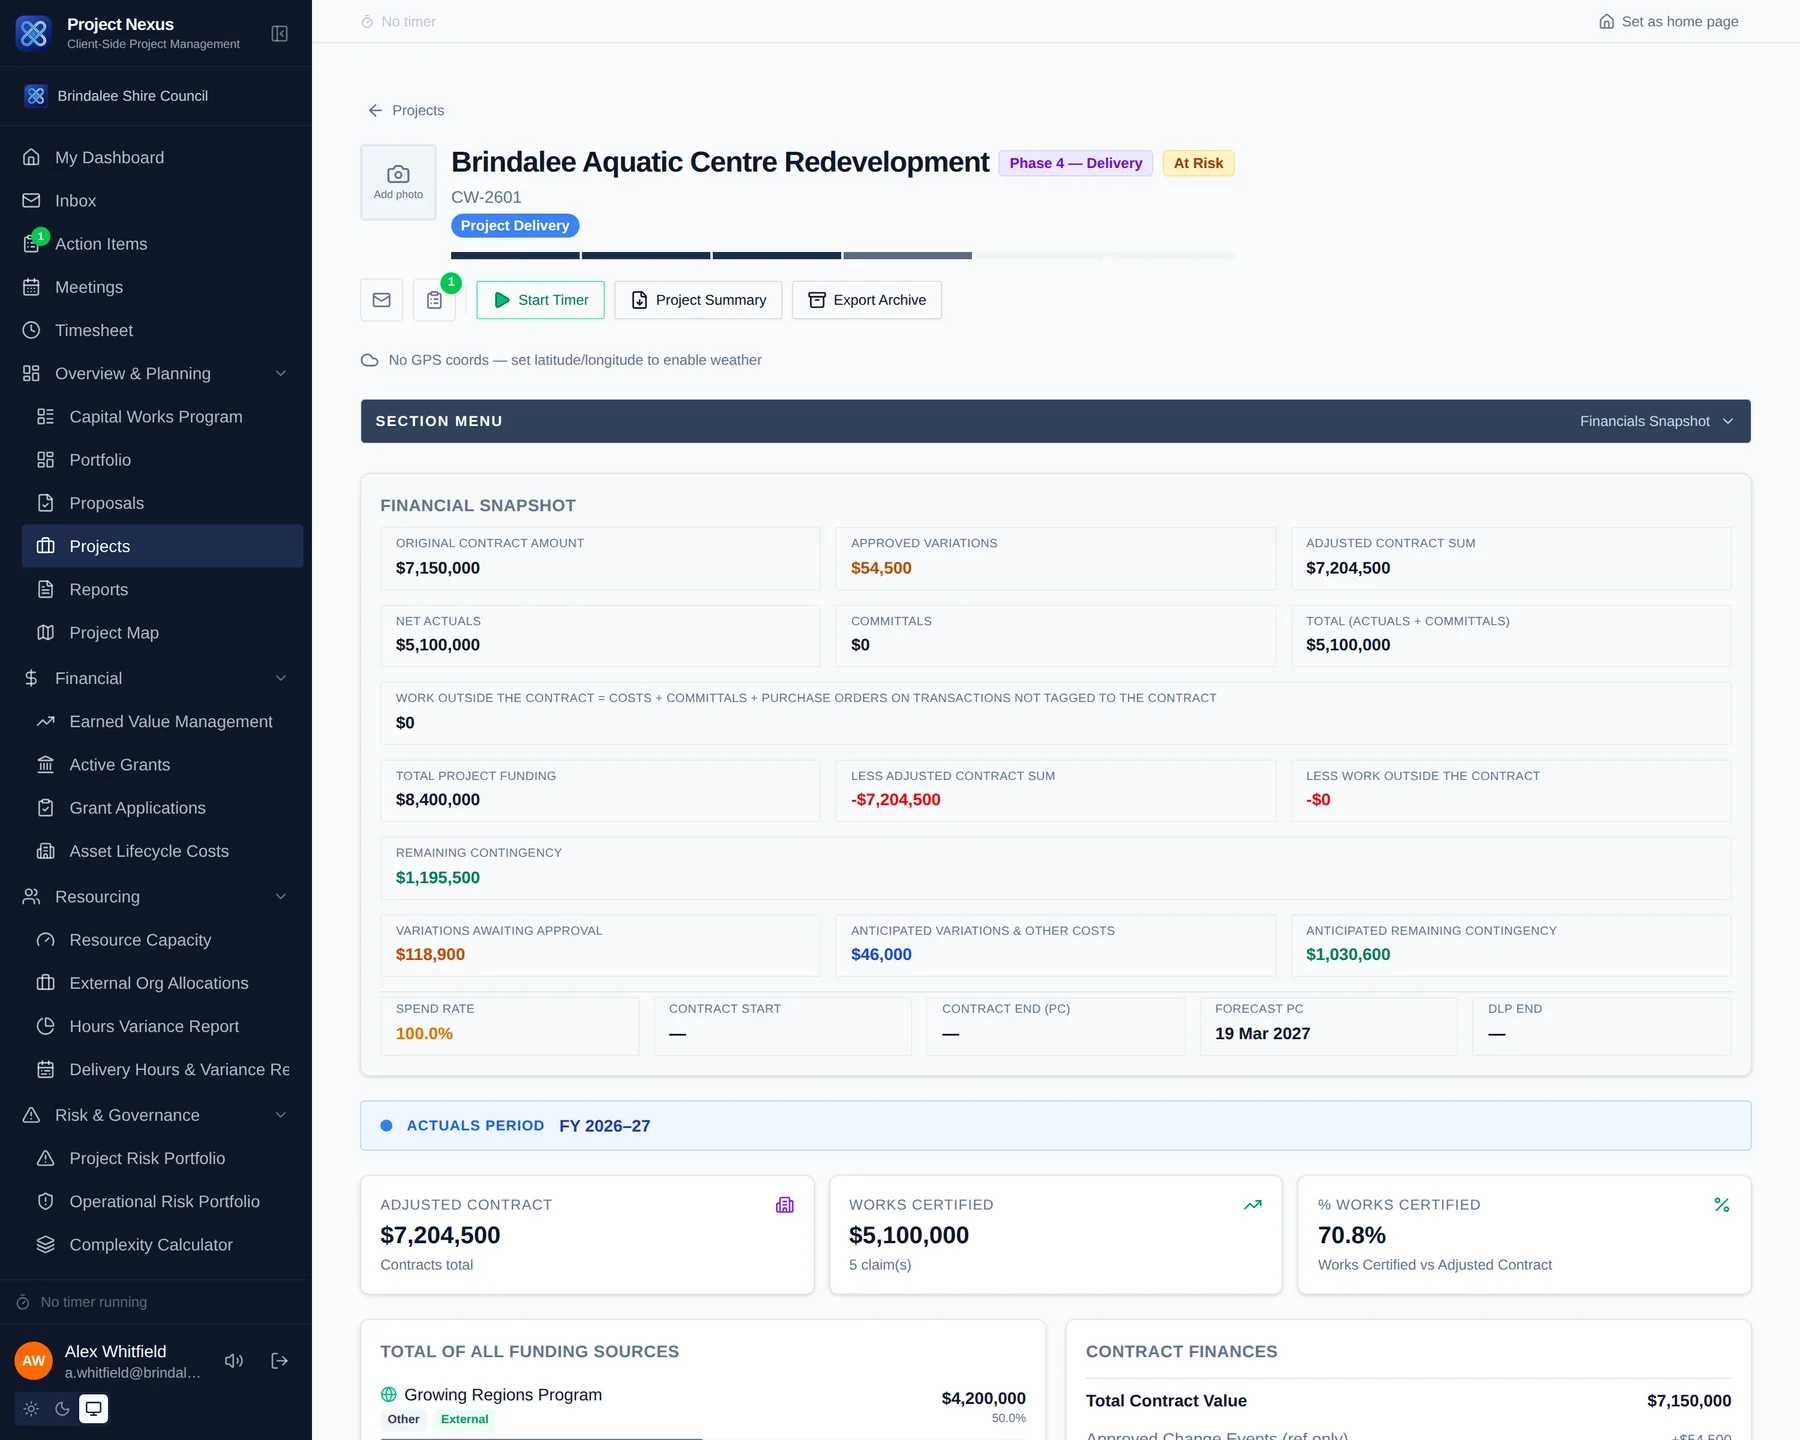
A project financial snapshot showing original contract amount, approved variations, adjusted contract sum, net actuals, remaining contingency and spend rate
Financial snapshot — contract sum, approved variations, actuals and remaining contingency on one screen

Financial Management Financials & Grants

Budget tracking
The Financials tab shows the project budget, committed costs, actuals to date, and forecast final cost. Funding sources (grants, council contributions) are tracked separately.
Magiq budget import
Import a Magiq-format Excel file to populate the monthly budget breakdown (Jul–Jun financial year). Export back to Magiq format for reconciliation.
Purchase orders
Create and track purchase orders against the project budget. Each PO shows its line items, amounts, and current status.
Contracts
Record head contracts and variations. Track awarded value, revised contract sum, and remaining contract budget.
Contract retention
The Contracts section tracks retention held and released in two stages — Practical Completion (PC) and Defects Liability Period (DLP). The Snapshot section shows total retention held across all contracts.
Civica import
Import actuals data from Civica (council finance system) via the bulk import function to keep actuals in sync. A downloadable template is available — see 'Bulk Import Templates' under Administration.
Monthly actuals
Enter monthly actual expenditure figures in the Monthly Actuals section to maintain a detailed spending record by calendar month.
Progress claims & S-Curve
Track contractor progress claims against the contract sum on the Progress Claims sub-tab. The S-Curve sub-tab plots planned vs. actual cumulative spend over time for an at-a-glance schedule/cost comparison.
Prediction Advanced
The Prediction Advanced sub-tab forecasts likely final cost and cash flow based on spend trends to date, feeding the Cash Flow Prediction section of the Project Summary PDF.
Lifecycle Costing
The Lifecycle Costing sub-tab estimates the whole-of-life cost of the asset being delivered, complementing the portfolio-wide Asset Lifecycle Costs page.

EVM Metrics Financials & Grants

What is EVM?
Earned Value Management (EVM) is a project performance measurement technique that integrates scope, schedule, and cost data into a single view of project health. It follows PMI Practice Standard for EVM (3rd Ed) and AS 4817:2006.
Key metrics
The EVM tab shows: Budget at Completion (BAC), Earned Value (EV), Planned Value (PV), Actual Cost (AC), Cost Performance Index (CPI), Schedule Performance Index (SPI), Cost Variance (CV), Schedule Variance (SV), Estimate at Completion (EAC), Estimate to Complete (ETC), Variance at Completion (VAC), and To-Complete Performance Index (TCPI).
Interpreting CPI
CPI ≥ 1.0 means you are delivering more value than money spent (under budget). CPI < 1.0 means spending exceeds value delivered (over budget).
Interpreting SPI
SPI ≥ 1.0 means the project is progressing ahead of the baseline schedule. SPI < 1.0 means it is behind schedule.
TCPI
The To-Complete Performance Index shows the cost efficiency required on remaining work to finish within BAC. TCPI ≤ 1.0 is recoverable; TCPI > 1.1 is statistically very unlikely to recover without re-baselining.
Data sources
BAC comes from the Magiq budget import (or Approved Budget). PV is cumulative Magiq budget to the current date. AC comes from Monthly Actuals (or Civica imports). % Complete is taken from the latest Progress Report.
Portfolio-wide view
This tab covers EVM for a single project. To compare CPI/SPI and cost exposure across every project in the organisation at once, see 'EVM Portfolio' under Portfolio & Analytics.

Funding & Grant Acquittal Financials & Grants

Recording funding sources
On the Financials tab's Funding section, record every grant, council contribution, or other income source funding the project. Each row captures the funding source name, category, and dollar amount. Set a funding record's category to 'External' for it to be picked up by the portfolio-wide Active Grants page — internal contributions are excluded there by design.
Total Funding
A project's Total Funding is the sum of its funding-source amounts (grants + council contributions). If no funding rows are recorded, Total Funding falls back to the project's Approved Budget instead, so a project always has a usable funding figure even before its funding breakdown is entered in detail. This is the figure used for 'Portfolio $' on Project Manager Allocation and for Active Grants totals — it is deliberately a different number from 'Total Org Approved Budget', which is the project's own budget field regardless of how it's funded.
Grant Acquittal tagging
On the Transactions sub-tab, tag any transaction against a funding source using the Grant Acquittal column — a dropdown listing every funding source recorded for the project (by funder + program name), or 'Internal' for transactions not tied to external funding. Bulk-select multiple transactions and tag them all at once from the toolbar.
Acquittal milestones
Record acquittal milestones and reporting deadlines for each funding source — due date, submitted date, approved date, and the amount claimable at each milestone — so grant reporting obligations are tracked alongside the money.
Portfolio-wide view
This section covers funding for a single project. To see External funding totals and acquittal milestone health across every project at once, see 'Active Grants' under Portfolio & Analytics.

Grant Application Financials & Grants

What is it?
The Grant Application tab captures a structured readiness assessment before pursuing a prospective grant for the project — distinct from Funding & Grant Acquittal, which tracks money already secured.
Readiness questions
Seven yes/no questions are recorded: familiarity with grant guidelines, Council eligibility, adequate time to submit, funding history, alignment with the Council Plan, SLT notification, and whether matching funding is required.
Readiness score (out of 5)
The readiness score counts only five of the seven questions as go/no-go criteria — guideline familiarity, Council eligibility, adequate time to submit, alignment with the Council Plan, and SLT notification. Funding history and matching-funding-required are recorded as informational context but deliberately excluded from the score.
Recommendation
Record a Proceed / Do Not Proceed / Pending recommendation alongside the readiness assessment.
Portfolio-wide view
This tab covers one prospective application. To see readiness scores and recommendations across every project's grant applications at once, see 'Grant Applications' under Portfolio & Analytics.

Team & Collaboration

8 topics · 25 capabilities
A resource capacity heat map showing each person's allocation percentage week by week, with overcommitted periods highlighted
Who is allocated to what, and where the next twelve weeks overcommit somebody

Project Team Team & Collaboration

Team members
The Project Team tab shows who is assigned to the project. Roles include Project Manager, APM, Support, Sponsor, and External.
Adding members
Click 'Add Member', select a user, and choose their role. Only one Project Manager can be assigned per project.
Contact register
The contact register shows all stakeholders and team members across the portfolio with their roles and project involvement.

Meetings & Action Items Team & Collaboration

Site meetings
Record site meeting minutes — attendees, agenda items, discussion, and action items. Custom meeting types can be created by administrators in User Settings.
Attendees from Contacts New
Add attendees and apologies straight from your organisation's Contacts register, filterable by Internal, External, or Stakeholder — each shown with a colour-coded badge — instead of typing details from scratch every time. A free-text option remains for anyone not yet in the register.
Presenting on a large screen New
The meeting minutes editing screen widens and switches to a sidebar layout on large monitors, so the full meeting structure stays visible and there's more room to work — designed to be presentable when screen-sharing in Teams or Zoom.
Ad-hoc meetings
Log any meeting not linked to a specific project, useful for portfolio-level discussions.
Action items
All action items from meetings are consolidated in the Action Items page. Filter by due date, assignee, project, or status.
Project calendar
The Calendar tab (default landing tab on a project) shows all meetings and milestones for that project in a monthly view. Subscribe via iCal for personal calendar integration.

Timesheet Team & Collaboration

Logging time
Use the Timesheet page to log hours worked on each project each week. Select the project, task type, and enter daily hours.
Timer widget
Use the live timer in the sidebar to track time against a project in real time. Stop the timer to add the duration to your timesheet.
Finalising & export
Finalise your timesheet at the end of the week. A PDF summary is generated and can be emailed or downloaded.

Contractor Performance Team & Collaboration

CPR assessments
Create Contractor Performance Reports (CPRs) for contractors working on your projects. Rate them across quality, time, safety, and cost management.
Issue tracking
Record specific performance issues within a CPR, categorised by type and severity.
Performance history
View the full performance history for a contractor across all projects and time periods.

Notification Preferences Team & Collaboration

Per-user settings
Each user can configure their own notification preferences from User Settings → Notifications. Choose which events trigger an in-app notification or email.
Notification types
Configurable events include: action item assigned, milestone overdue, risk review due, document uploaded, meeting scheduled, defect assigned, progress report submitted, and more.
Email notifications
Enable email delivery for high-priority notifications so you are alerted even when not logged into the platform.

Inbox & Notifications Team & Collaboration

Inbox
The Inbox shows all system notifications, mentions, and messages directed at you — including action item assignments, approvals, and document shares.
Unread count
The inbox badge in the sidebar shows your count of unread messages. Click to view and clear them.
Project messages
Each project has its own Messages tab for team discussions specific to that project.

Live Chat Team & Collaboration

Project chat
Each project has a live chat channel accessible from the Chat tab. Chat messages are designed for quick real-time communication, separate from formal project messages.
Notifications
Unread chat messages are shown as a badge on the Chat nav item. The badge count resets when you open the chat.
User avatars
Set a profile photo or emoji avatar from your User Settings. Your avatar appears beside your messages in chat.

Email Signature Team & Collaboration

Setting your signature
Set a plain-text email signature from User Settings. It is automatically appended to outgoing emails sent from the platform, such as document transmittals.

Reporting & Insights

2 topics · 4 capabilities
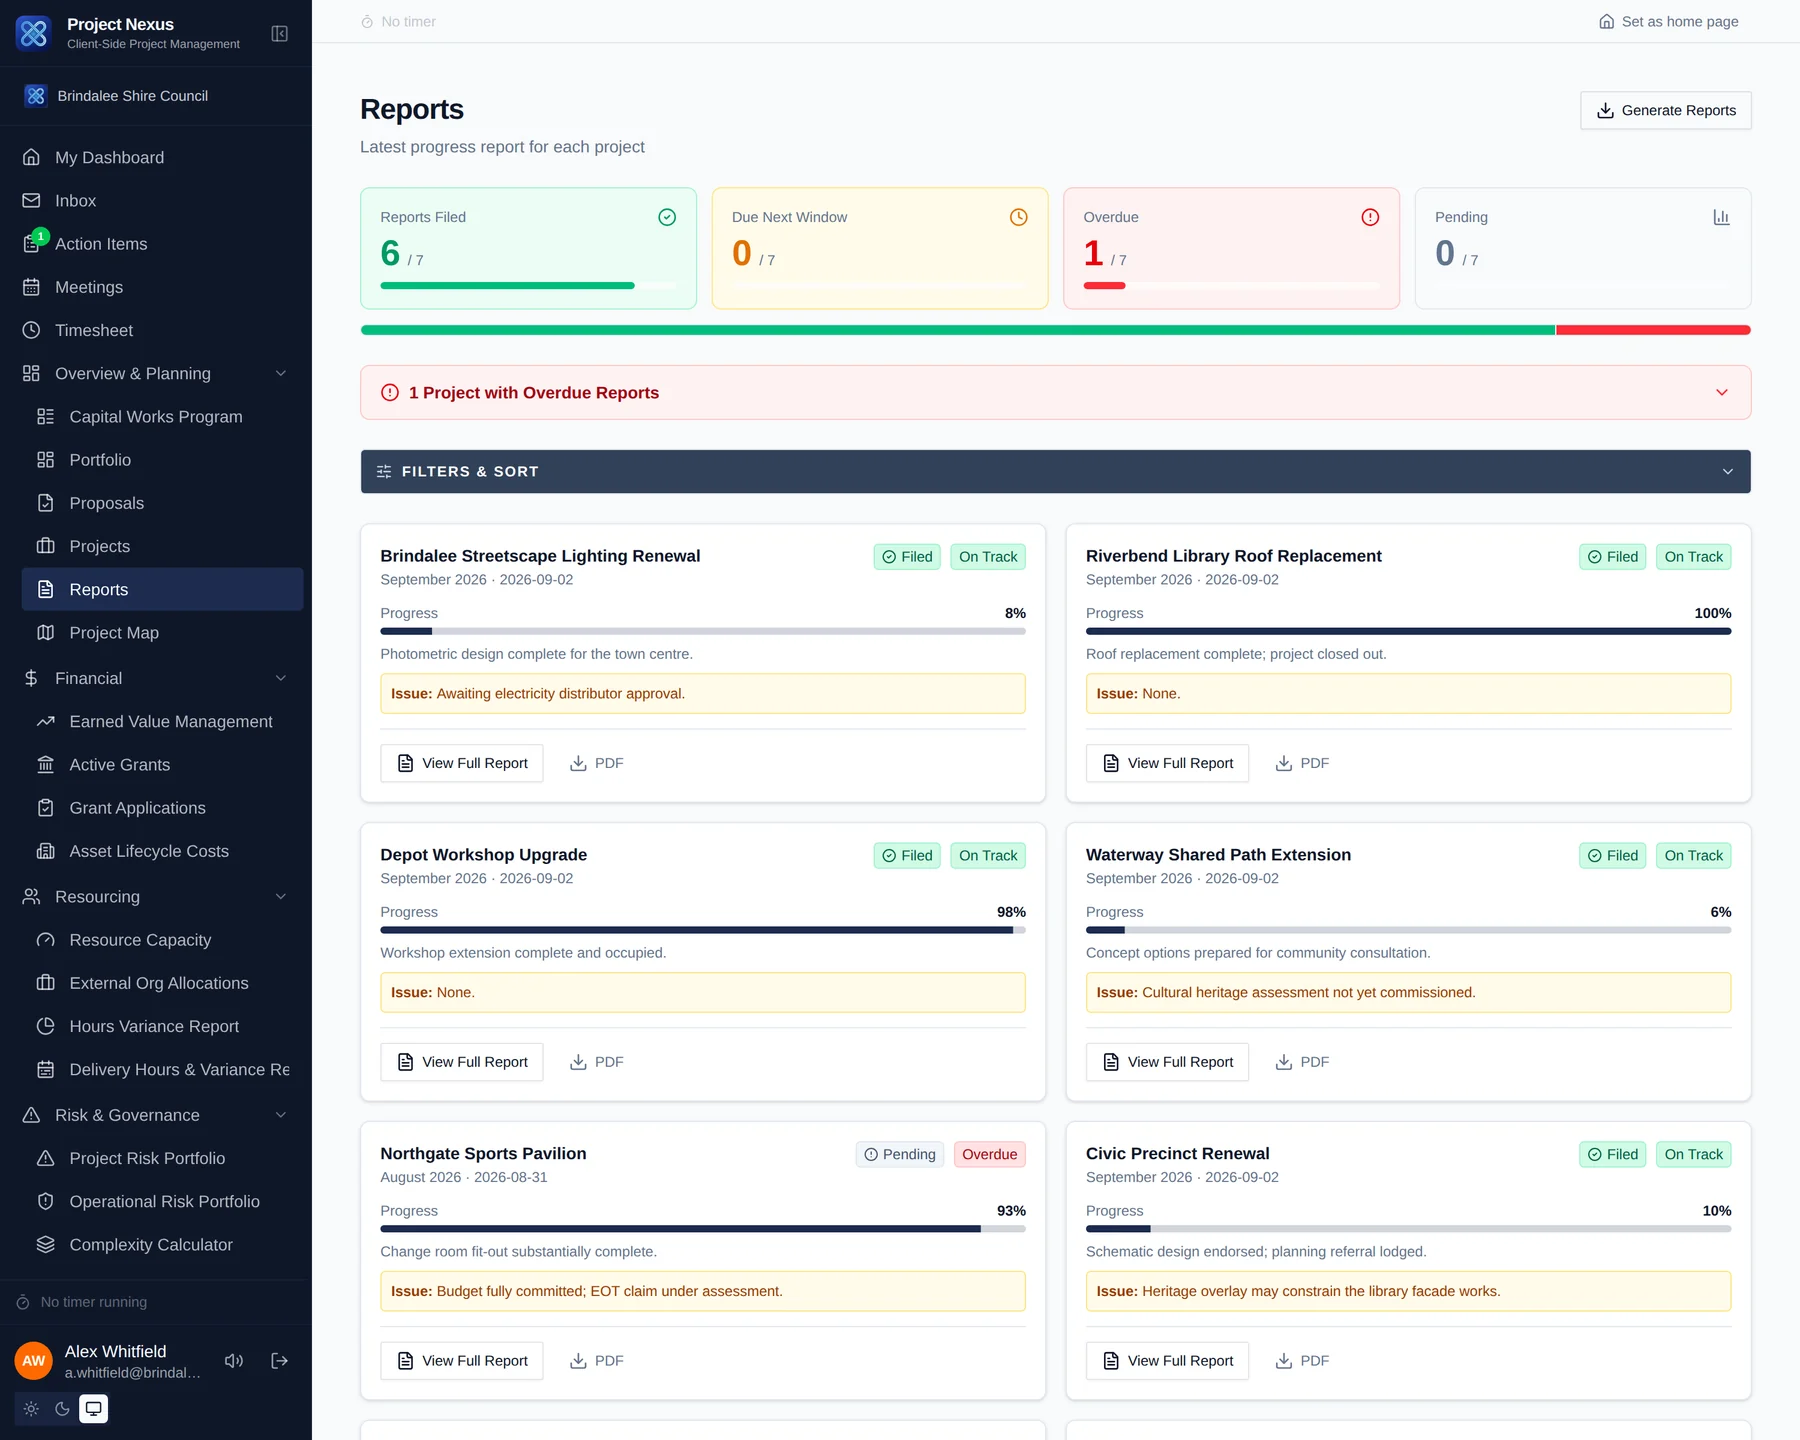
The reports page showing how many projects have filed a progress report this period, and a card per project with progress, status and current issue
Progress reporting across the program — filed, due and overdue at a glance
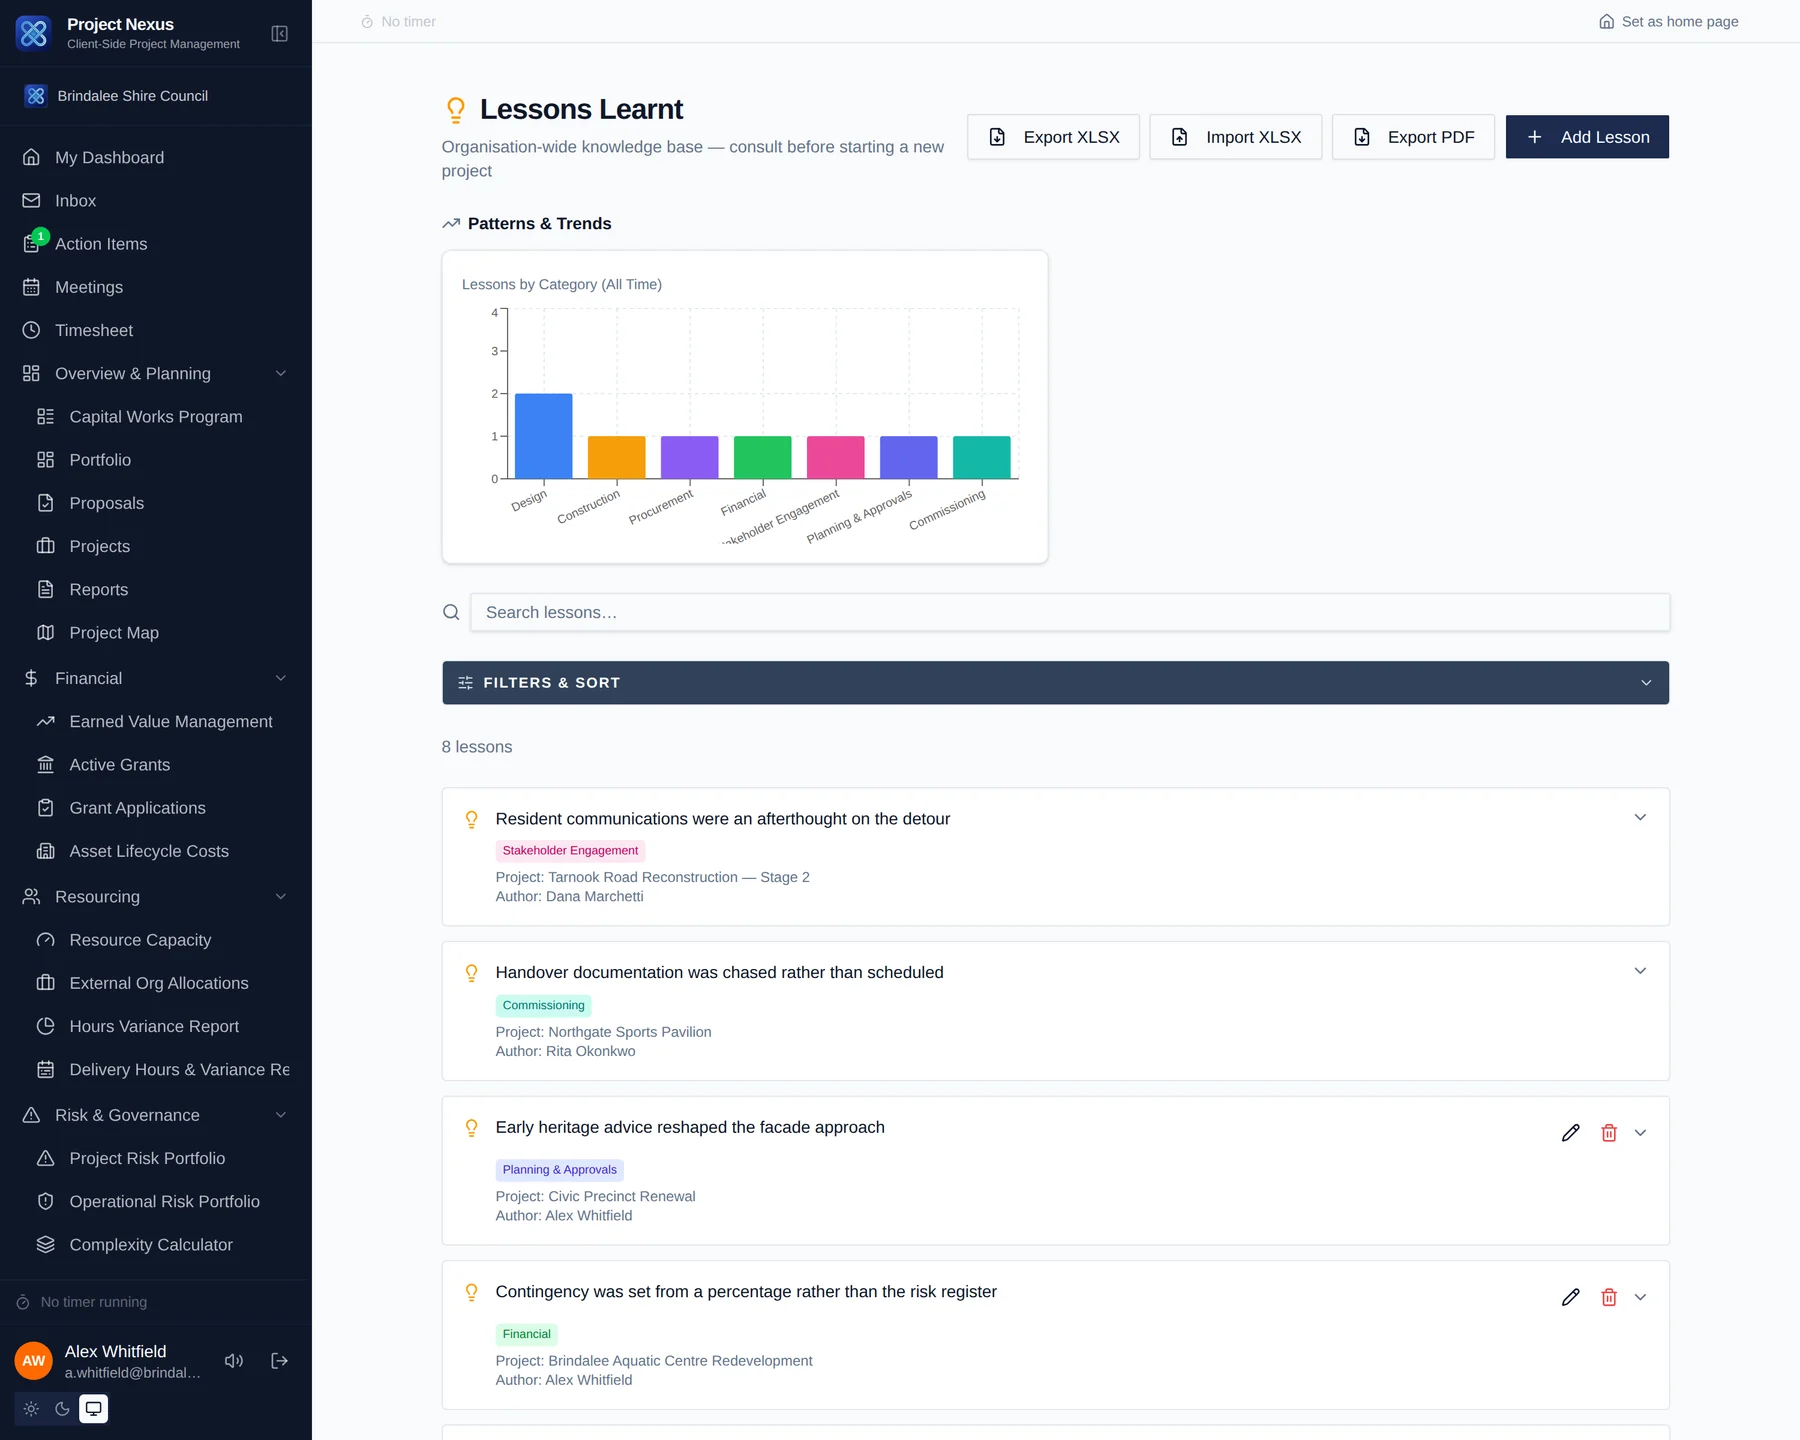
The lessons learnt page with a bar chart of lessons by category and a list of lessons, each tagged with its category and source project
Lessons learnt as a searchable organisational record, not a document nobody reopens

Post Occupancy Evaluation Reporting & Insights

POE assessments
Post Occupancy Evaluations capture feedback on completed projects after handover. They assess whether the project met its objectives.
CSAT surveys
Import customer satisfaction survey results (from Microsoft Forms or equivalent) to track stakeholder satisfaction over time.

Knowledge Base & Lessons Learnt Reporting & Insights

Knowledge base
A library of articles, guides, and resources relevant to project delivery. Administrators can add and manage articles.
Lessons learnt
Record lessons learnt from completed or in-progress projects. Lessons are tagged by category so they can be searched and applied to future projects.

Administration

4 topics · 19 capabilities
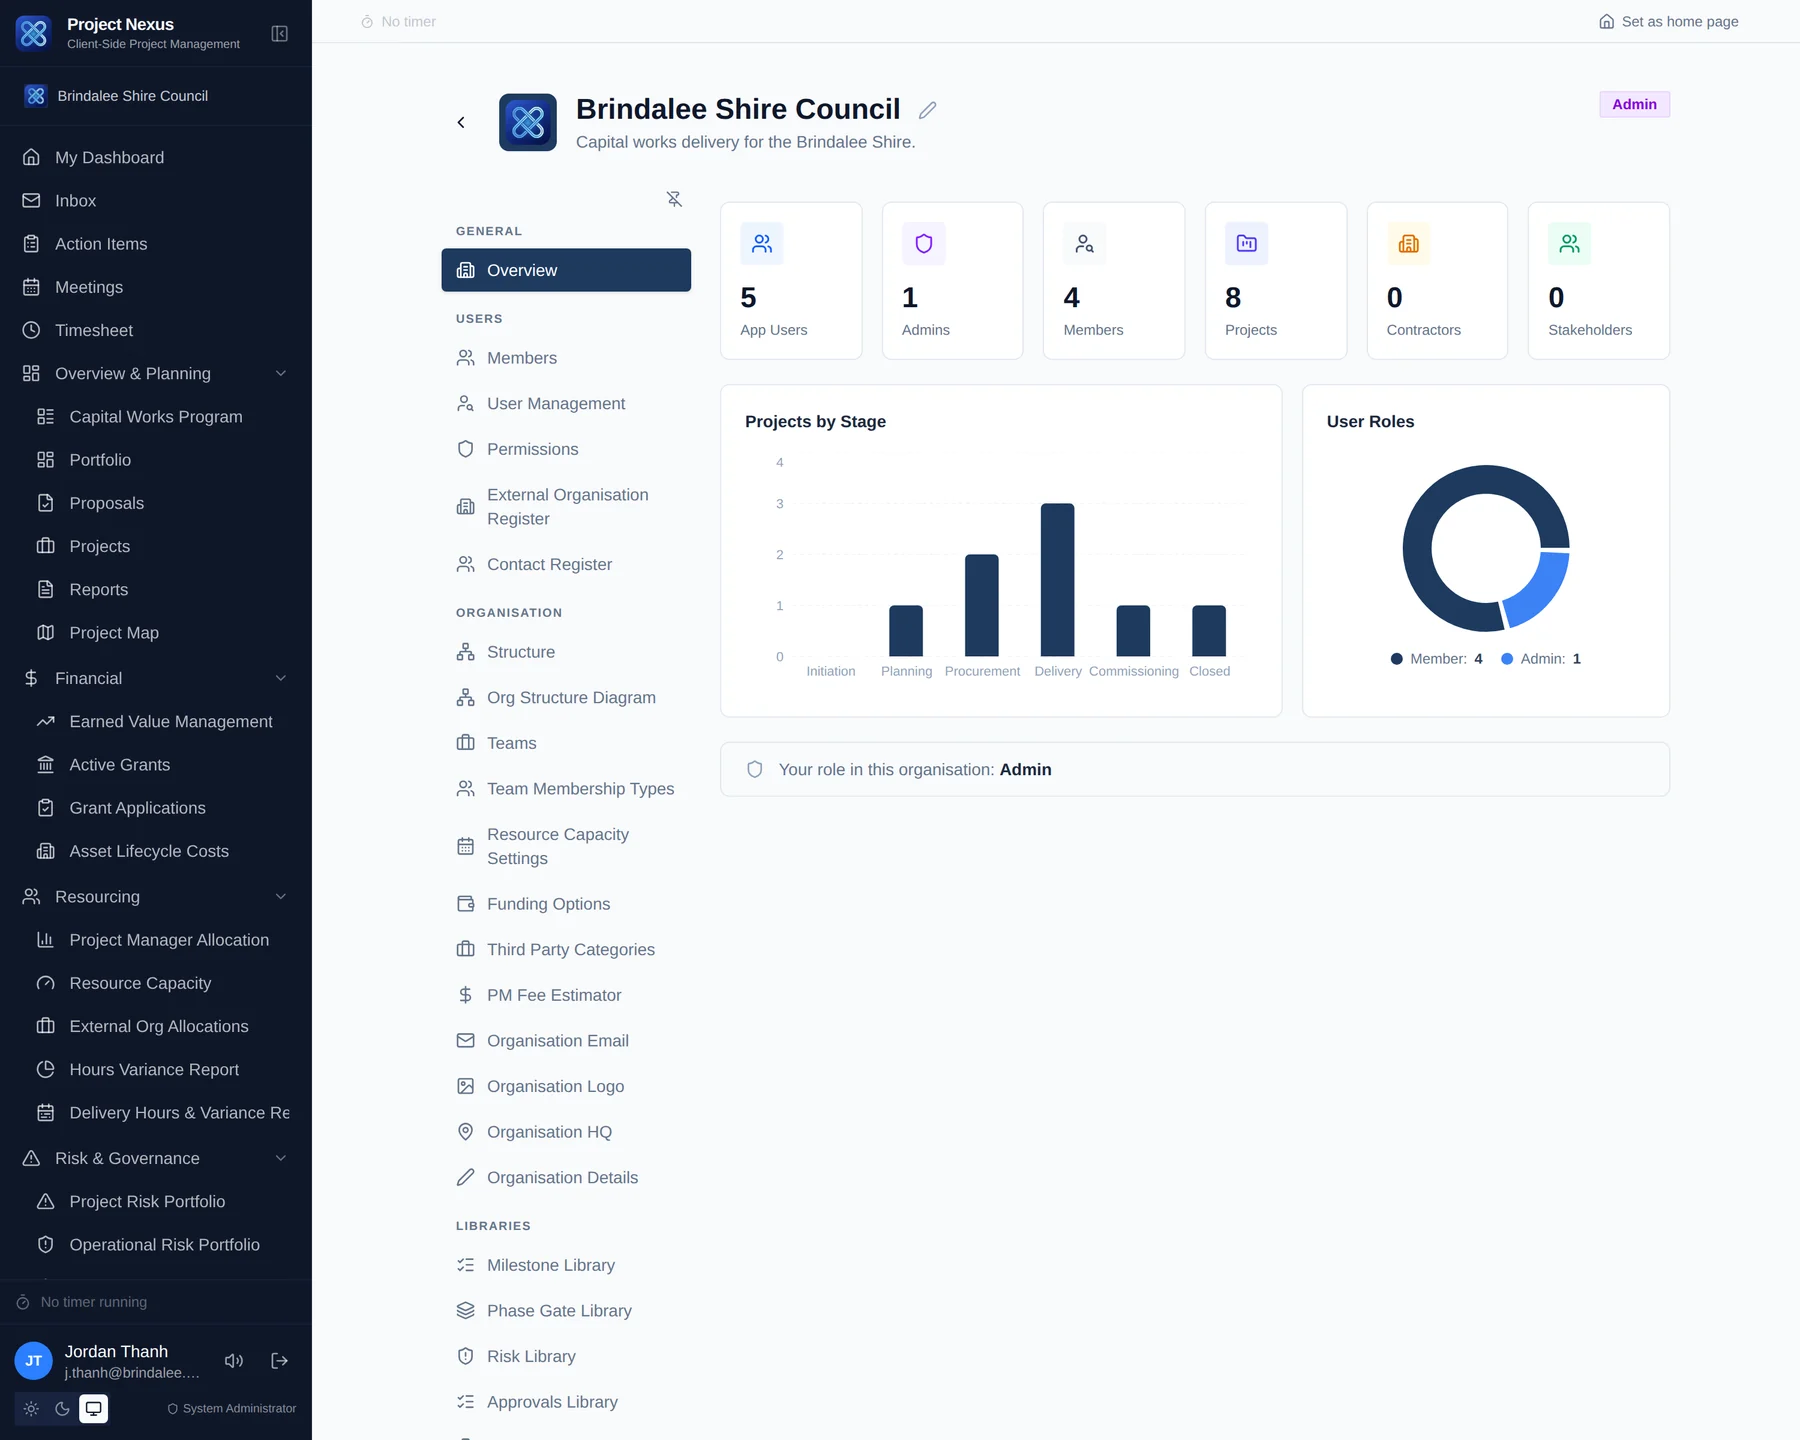
The organisation administration page showing user and member counts, projects by stage, the split of user roles, and a menu of administration settings and libraries
Organisation administration — members, permissions, structure and the shared libraries

Organisation Dashboard & Admin Administration

Org dashboard
Administrators access org-wide settings, user management, team structure, departments, branches, checklist libraries, and approval checklist libraries from the Org Dashboard.
User management
Invite new users, set their roles and permissions, assign them to departments and branches, and manage their access level from Admin > Users.
Teams, departments, branches
Organise your structure using Teams, Departments, and Branches. Projects and users can be linked to any combination.
Logo and branding
Upload your organisation's logo in the Org Dashboard Settings tab. The logo appears in generated PDF reports and on the platform header.
Risk library
Manage a library of common risk entries that project managers can import into their project risk registers.
Retention alerts
The Org Dashboard shows a retention alerts panel listing all contracts where retention is held and the release status, so finance teams can track amounts due for release across the portfolio.
Funding Options New
Administrators maintain the organisation's list of funding source options (used by the Financials tab's Funding section and Grant Acquittal tagging) from Org Dashboard → Settings → Funding Options — add, edit, or retire funding categories org-wide.
Generated Reports & bulk actions New
The Generated Reports tab lists any historical PDFs/documents saved from an export before this was disabled — new exports are no longer saved here. Select multiple reports to bulk-download them as a single zip file, or bulk-delete them, filterable by report category.

User Roles & Permissions Administration

Role types
Users are assigned one of: General Manager, CEO, Manager, Project Manager (General/Senior), Project Officer, Read Only, or Admin (super-admin). Admins have full access to all features.
Navigation permissions
Each role controls which navigation items are visible and which actions can be taken.
Stage advancement roles
Only users with the Manager, General Manager, CEO, or Admin role can advance a project to the next stage.
Preview mode
Super-admins can impersonate any role to test what they would see. The amber banner at the top indicates when preview mode is active.

Org Structure Diagram Administration

Overview
From Organisation Settings, the Org Structure tab visualises your department/branch/team hierarchy as an interactive diagram — leaders, members, and reporting lines at every level.
View styles New
Choose between Tree (Vertical), Tree (Horizontal), Outline, Directory Table, or Treemap (sized by headcount) — each available both on-screen and as a downloadable PDF.
PDF export sizing New
The Tree PDF exports are sized to fit the whole diagram on one page automatically, however large the organisation — nothing is cropped off the edge.

Bulk Import Templates Administration

Overview New
Several areas of the platform support bulk data entry via a downloadable Excel (.xlsx) template: fill it in offline, then upload it back to create or update many records at once.
Where it's available New
Bulk import templates exist for: creating multiple Projects at once, bulk-updating existing Projects' core fields, and importing Civica financial transactions.
How it works New
Click 'Download Template' to get a spreadsheet with the correct column headers and an example row, plus an Instructions sheet explaining valid values for each column. Fill in your data below the header row, save, then use the matching 'Import' button to upload it.
Capital Works format
The Projects bulk-create template also auto-detects the council's standard Capital Works Program spreadsheet layout (Rates/SLSRP/RTR/DCP columns), so an existing budget spreadsheet can often be uploaded directly without reformatting.